Stock market illusions part 2: equities lie, bonds tell the truth
In Part 1, I discussed what has been driving the stock market higher over the past 13 years. If you missed it, you can find it here. In Part 2, I am going to discuss the popular notion that the stock market is a “forward looking mechanism”. What that essentially means is that the stock market prices in future company earnings and thus, the future health of the economy. But, is that really the case? I am not going to dive into the history of the stock market, but instead I will look at the same time period I did in Part 1, which was from around the Global Financial Crisis until present time.
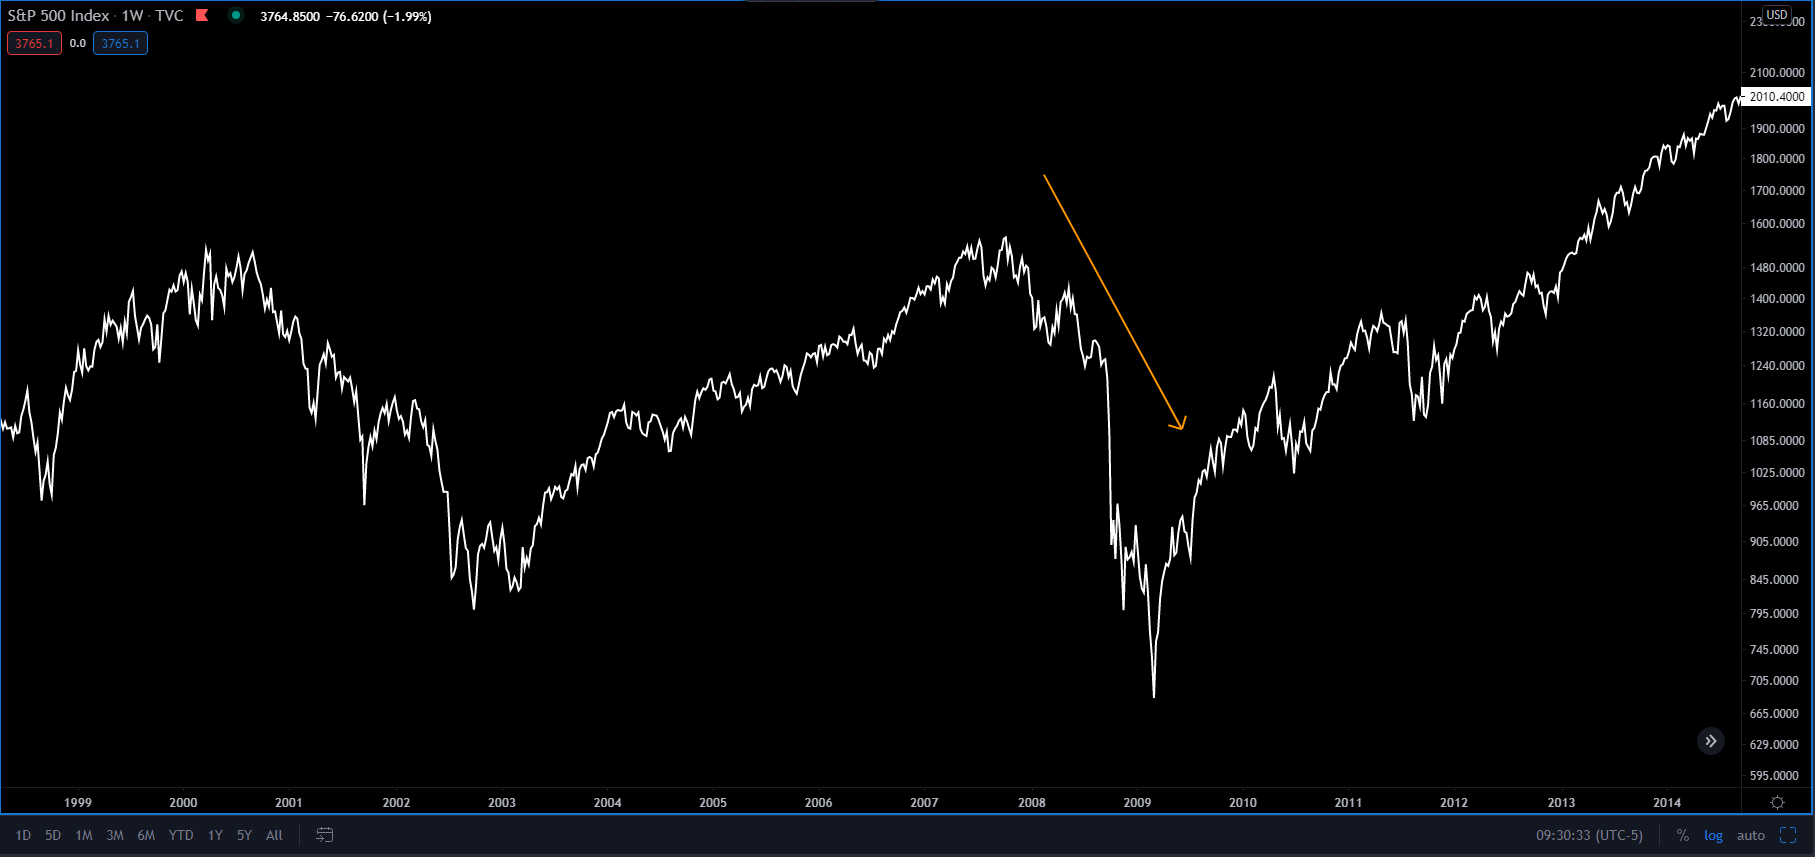
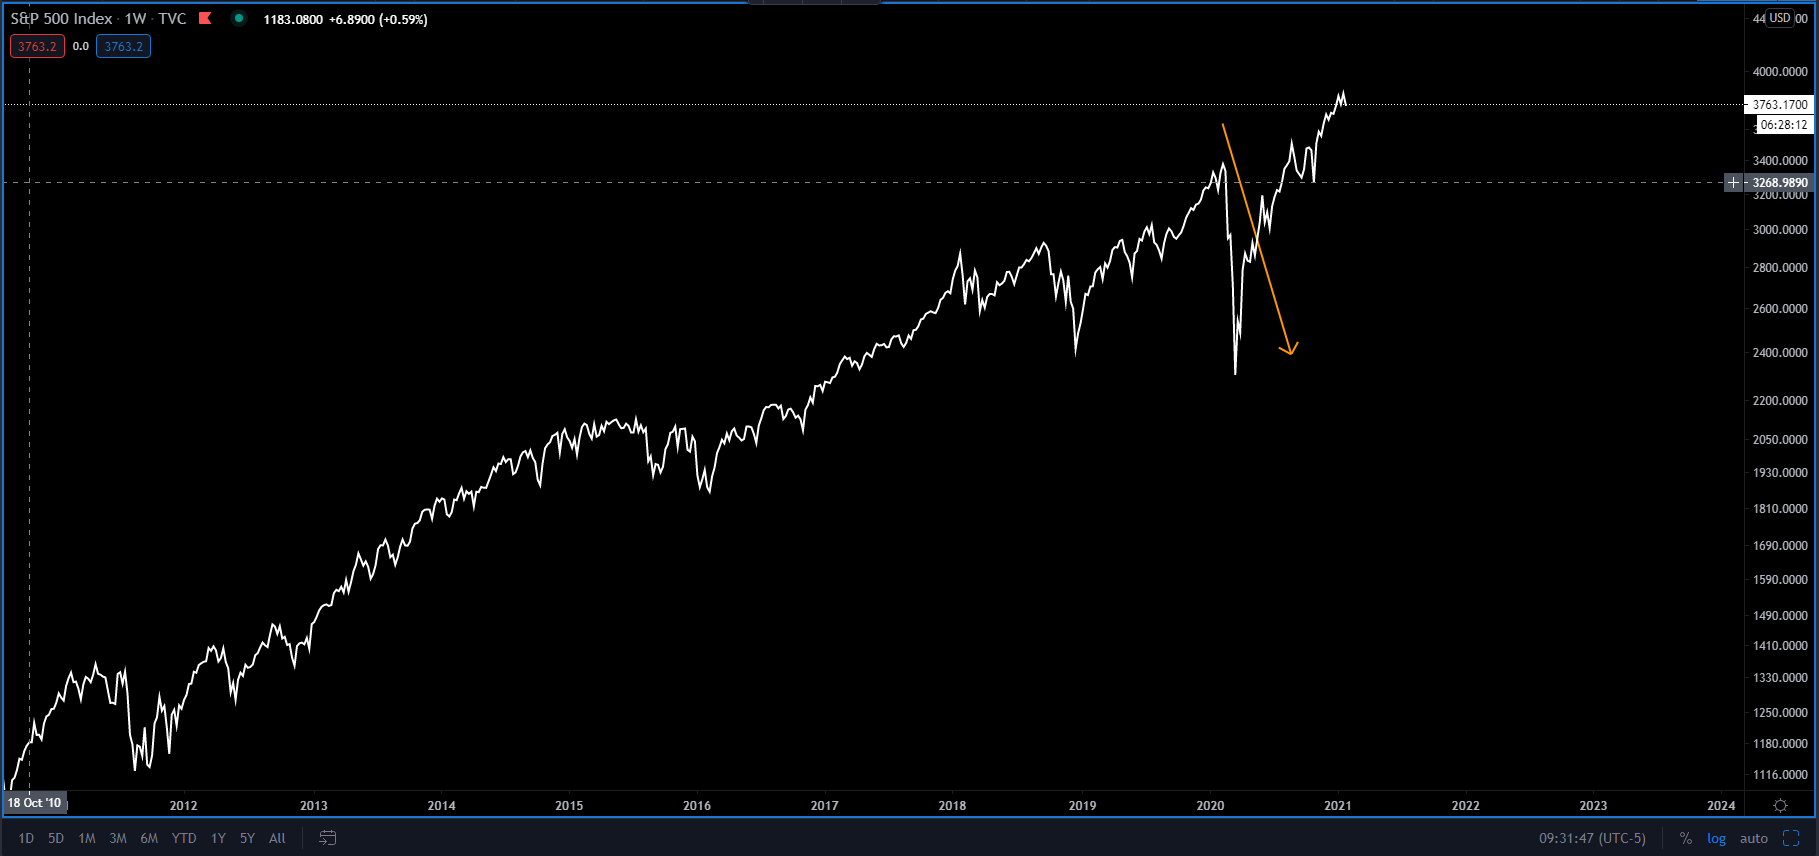
Let’s look (below) at the S&P 500 from 2007-08 and look how quickly the stock market unraveled. Now, let’s look (2nd chart) to less than a year ago, March 2020 and see how quickly the stock market unraveled. Leading up to those events, what exactly was the stock market forward looking to? The S&P 500 was at all-time highs in both scenarios, telling us that everything is well, now and in the near future. But, that wasn’t the case, was it? If the stock market was forward looking, it would have started grinding lower months before, to price in the poorer economic conditions that were right around the corner. After the tech bubble burst in 2000, it took the S&P 500 almost five years from its lows in 2002 to get back to the level it was at prior to the crash. From late 2007 until the end of 2008, the S&P was down almost 60%, wiping out five years of work. In 2020, the S&P fell 35% in just one month. This tells us that equities were way ahead of themselves – in fact, they were mis-priced. They were not forward looking, because if they were, either they wouldn’t have been at all-time highs when the selloff started, or economic conditions would not have worsened. But, since economic conditions worsened quite dramatically in both scenarios, it tells us that the stock market is a very poor indicator of future economic health.
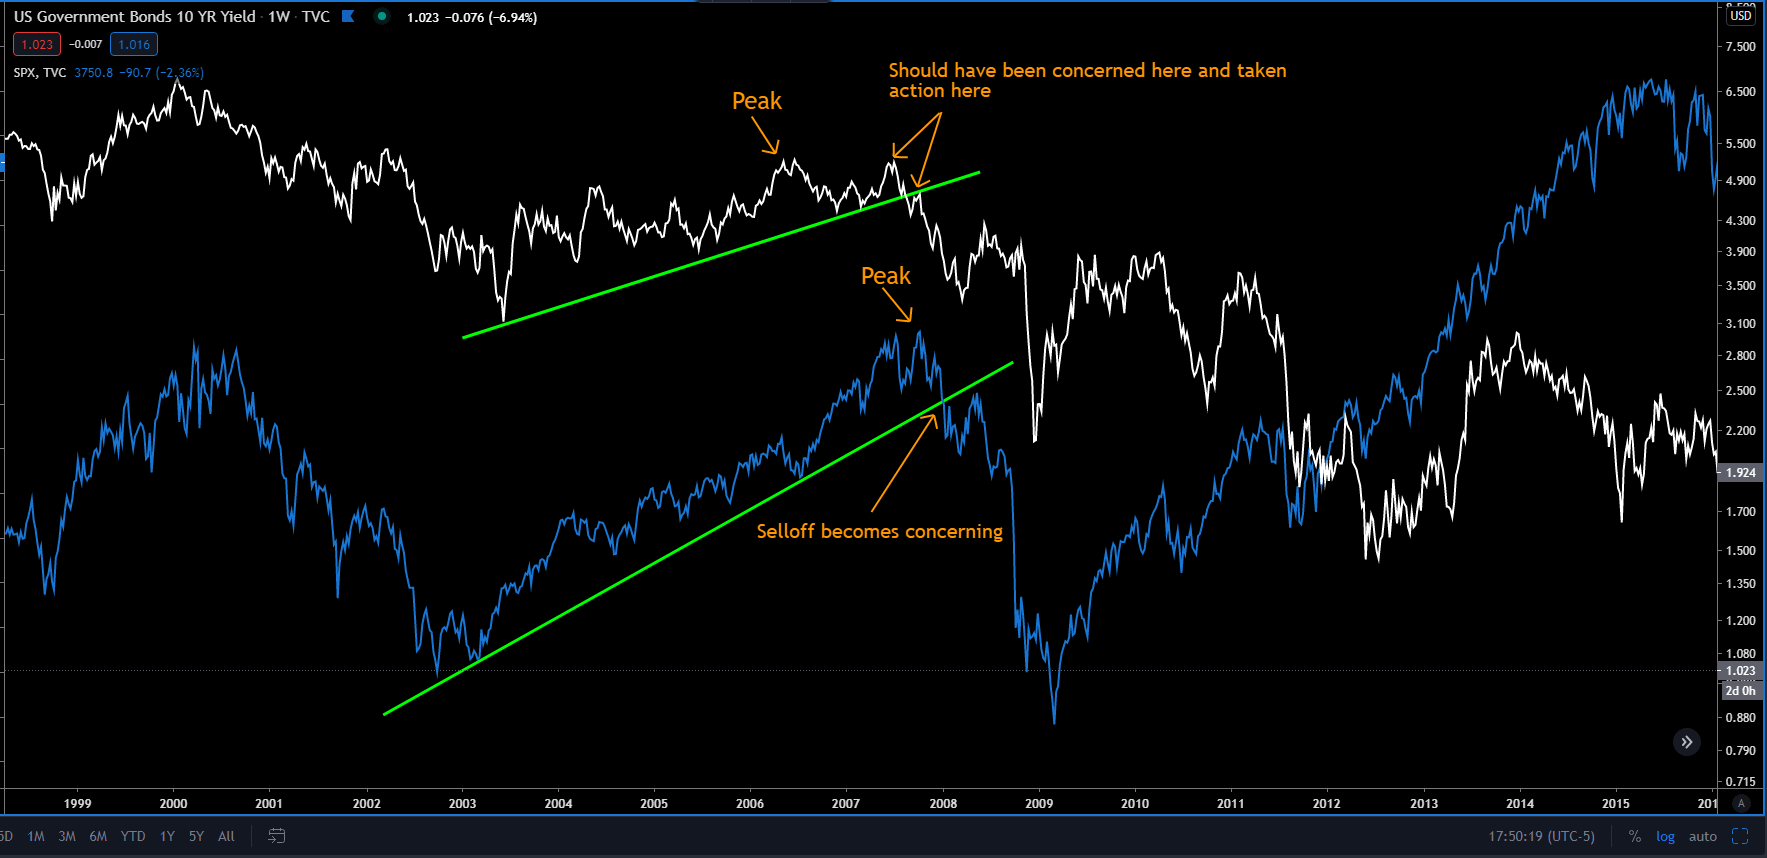
The bond market is a much more reliable indicator of where our economy is headed. It recently gave us a great example of what I am talking about in regards to pricing in future economic conditions months before an event strikes. Longer-dated bond yields (10-year +) do a good job of pricing in inflation and growth expectations. Rising yields is the bond market’s way of telling us that it expects economic growth in the near future. Falling yields is the bond market’s way of telling us that investors want to hold safe, liquid instruments because they expect economic conditions to worsen. If you look (below), I have the 10-year yield (white) alongside of the S&P 500 (blue). The 10s peaked in June of 2006, over a year before the S&P 500 peaked in July of 2007 and roughly a year and a half before the equities selloff became concerning. The 10s tried to get back above their June 2006 high in June 2007, but failed to and began their sharp descent from there. After the failure of the 10s to make a new high, they fell about 30% over the next 4 months from roughly 5.2% to 3.5%. It wasn’t until December 2007 that the S&P really started to break down, which again was 4 months after yields began their descent and had fallen over 30%. The stock market didn’t let anyone know a storm was brewing until the storm actually struck. However, the bond market gave off a warning signal in June of 2006 and confirmed that signal in August 2007, four months prior to the beginning of a period of worsening financial and economic conditions.
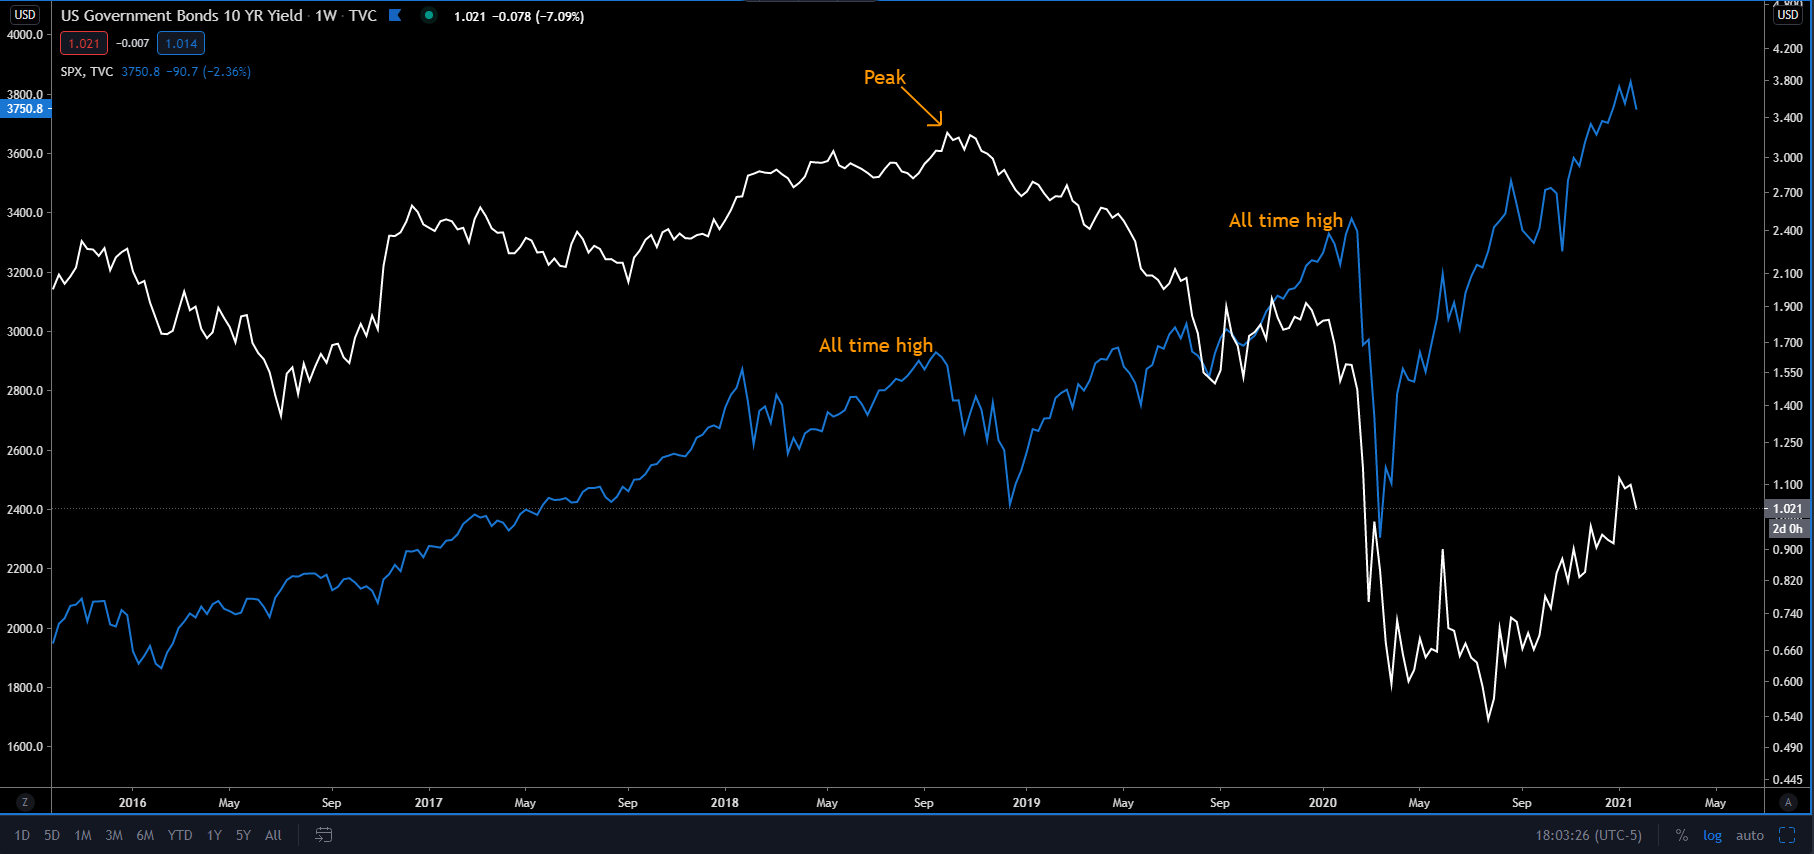
If we fast-forward to 2018, similar conditions preceded the March 2020 crisis. If you look (below) at the 10s (white) and the S&P (blue), you can see that the 10-year yield peaked in October 2018, preceding the crisis by almost a year and a half. When yields peaked, the S&P 500 had just created new all-time highs. The 10s then fell over 50% from October 2018 to March 2020, while the S&P went on to create even higher new all-time highs. Once late February, early March rolled around the S&P fell about 35% in just a few weeks. Again, the stock market was telling us everything was in good health now and in the near future but when reality set in, equities faced a crash in a very short-time frame. Markets do not crash 35% in just weeks if they are accurately priced, barring some unforeseen event like a terrorist attack or natural disaster. Now, one could argue that the Covid pandemic was unforeseen, which is true, but worsening economic conditions were not. The pandemic was just the trigger, the bond market was telling us something was wrong for almost 18 months. On top of that, the global manufacturing sector was already in a recession, there was a global slowdown in growth, and then we had the repo rate spike of September 2019, signaling global liquidity issues. The warning signs were there, yet equities ignored them, increasing 15% from October 2018 to February 2020. I’ll ask again, what was the stock market forward looking to?
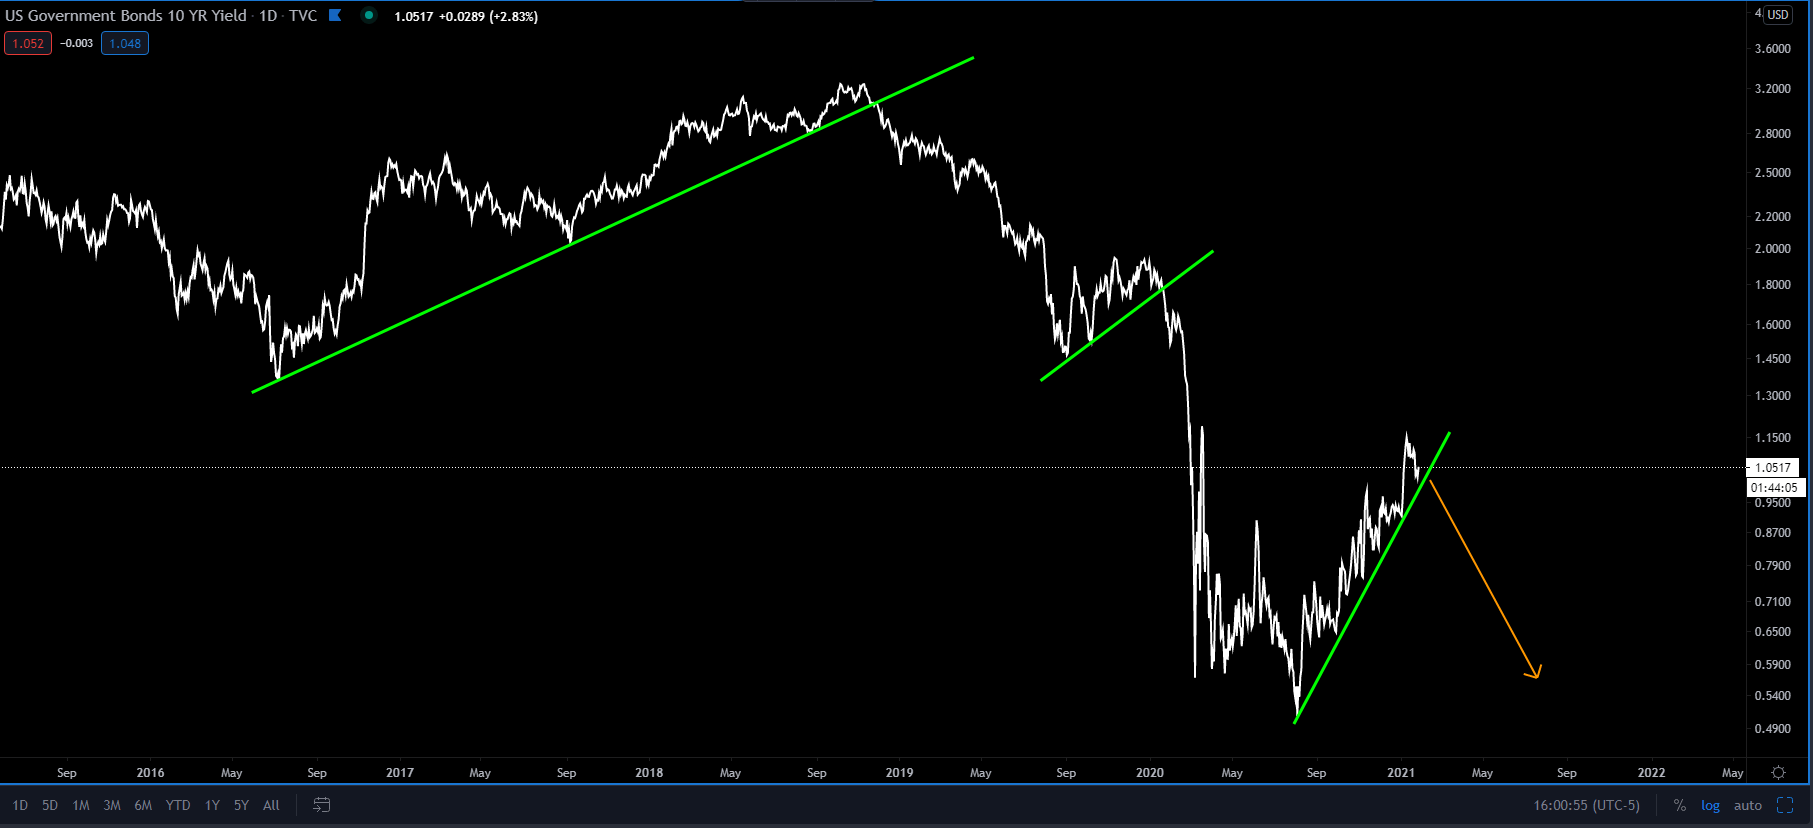
Now, here we are in early 2021 and the stock market has once again reached new all-time highs. Although yields have risen as of late, longer-dated yields are still well off their pre-pandemic levels last seen in February 2020. This should be worrisome to those that have bought into the mainstream narrative that runaway inflation and growth are coming this year. Why? Because despite nominal yields rising, their slow grind upwards and the levels they are at do not support the narrative, despite a massive flood of “stimulus” in the system. Another break lower in yields caused by a delationary shock is likely. Many will argue that the Fed’s QE has kept yields pinned down. While there is certainly some merit to this, I believe yields move independent from that which the Fed is doing, particularly longer-dated yields. The fundamentals support yields at these levels. In October 2018, yields peaked amid four rate hikes by the Fed that year. Yes, yields started falling as the Fed was still raising rates and continued to fall before the Fed finally reversed course in early 2019. Not only that, the Fed at the time was in the middle of tapering their balance sheet (selling Treasuries to remove them from their books) which should have meant a rise in rates (which did happen for a few short months). However, instead, rates fell for almost a year after their peak in 2018 before the Fed began buying Treasuries again (after the Sept 2019 repo rate spike), hence my belief that rates move independent of what the Fed is doing. Historically bond investors have been much more accurate in leading us to where the economy is headed compared to any central bankers.
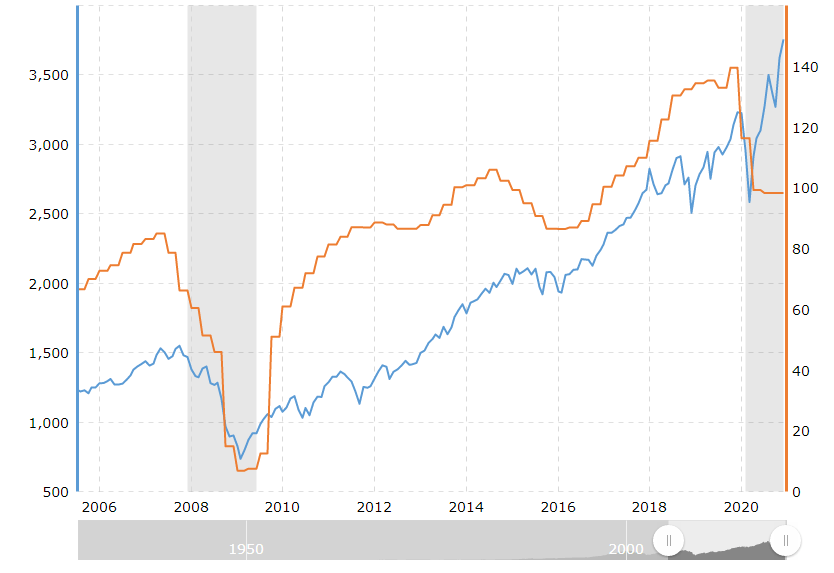
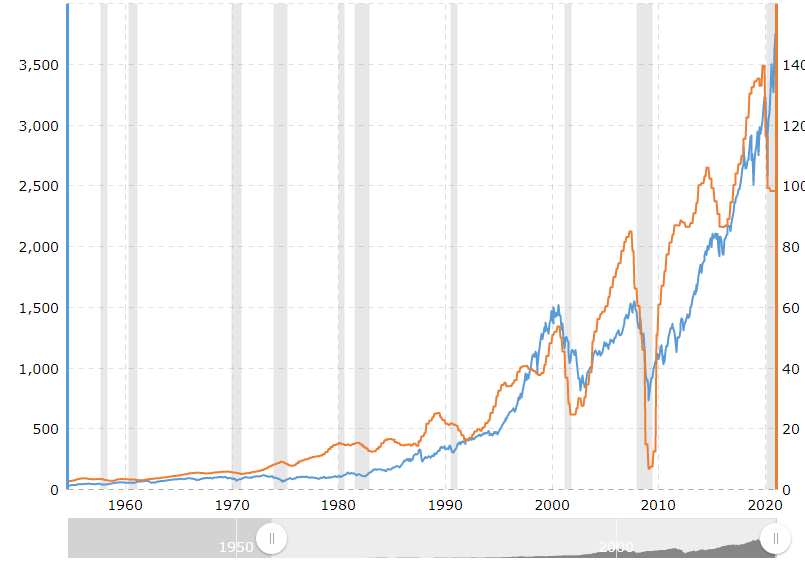
Just to give you an idea of how disconnected the current stock market is from reality, look below at the S&P 500 earnings (orange) and the price of the S&P 500 (blue). There is a big dislocation between the two and if you look at the 2nd chart (below) you can see that from a historical perspective, they normally move in the same direction. The move higher and higher in equities has been purely speculative and momentum based. Anyone trying to be aggressive on the short side has been chewed up and forced to cover rather quickly. But the higher equities go, further removing themselves from their fundamentals, the harder they will fall, which is exactly what the bears have been trying to time but with no success as of yet. But, like all speculative and momentum plays, it will fade and when it does, it will get ugly and in a hurry.
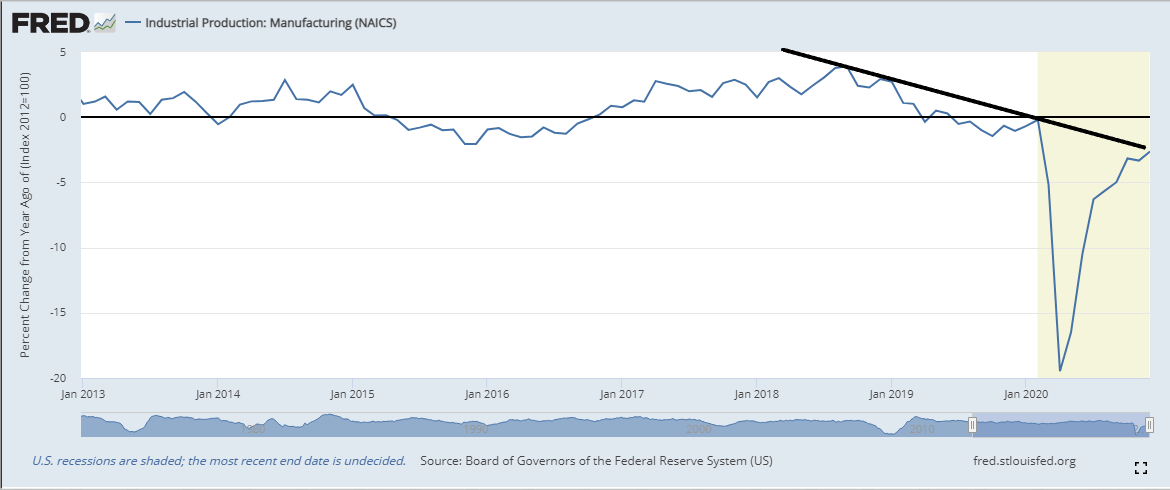
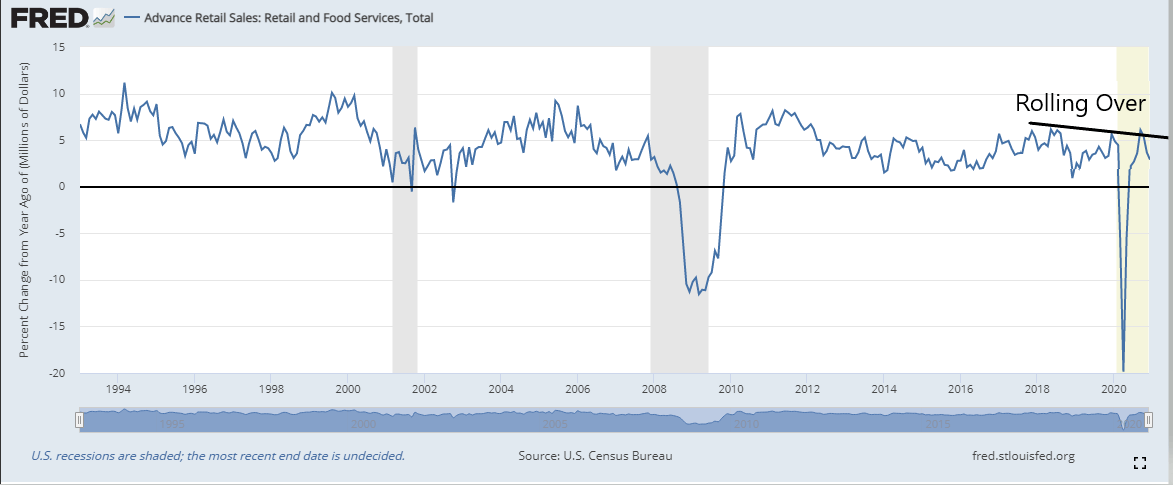
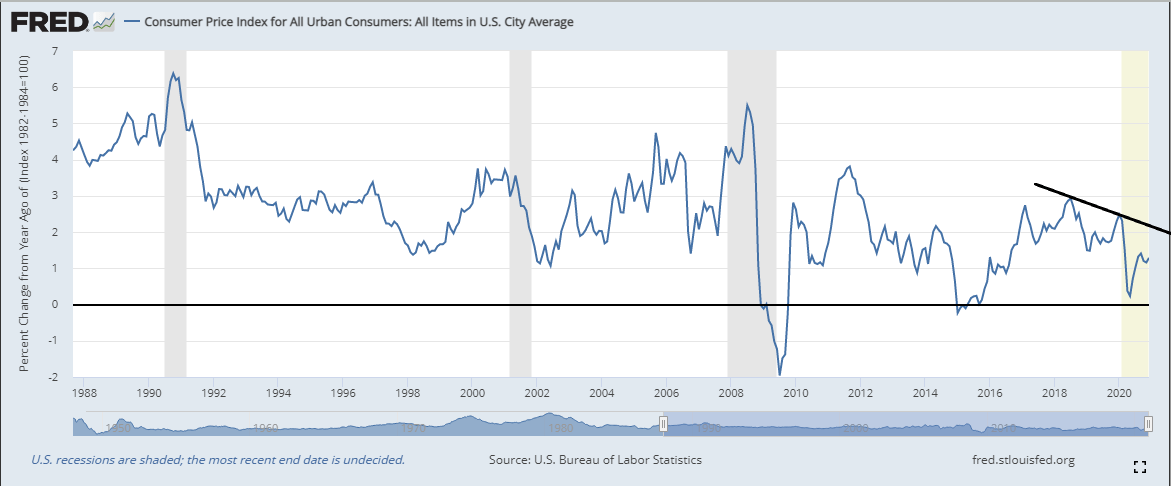
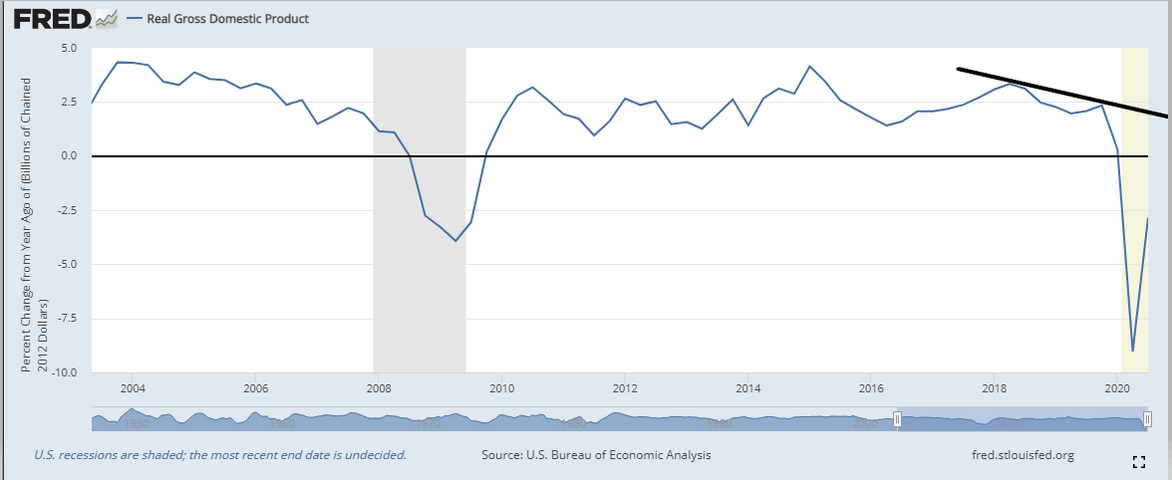
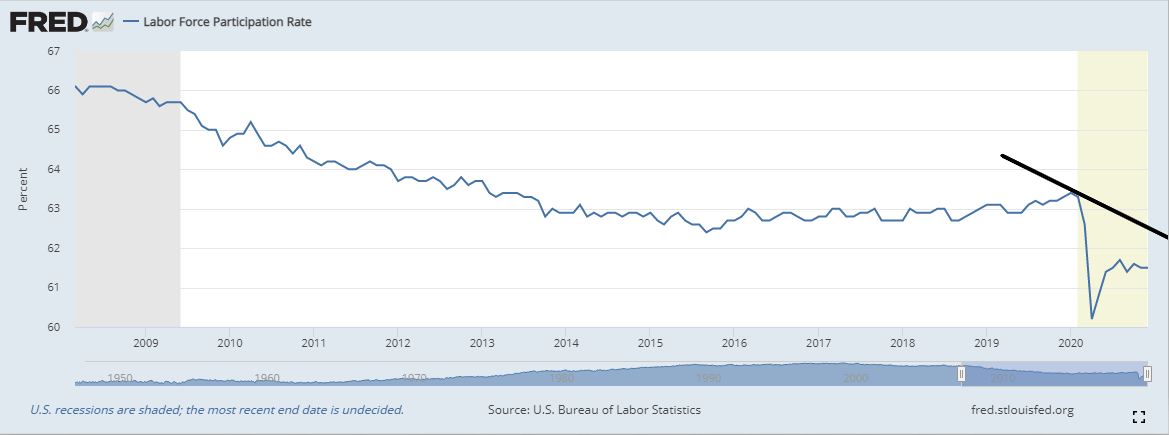
Some of those fundamentals can be seen in the economic data (below) in which many areas have completely stalled since showing signs of recovery back in the summer of 2020 or have already started to roll back over to the downside, telling us that there’s a discrepancy between expectations (mainstream narrative) and reality. A few trillion in “stimulus” couldn’t get the economy back to pre-pandemic levels but a few trillion more will do the trick? Many believe this to be the case. But, an increase in government spending is more harmful than authorities would like us to believe, which I discussed recently here. The rally in equities that has continued longer than many expected has become a speculative frenzy with short-sellers getting squeezed each time they try and time the inevitable reversal in arguably the biggest stock market bubble since The Great Depression. But, eventually it will come to an end (as always) because the stock market has become completely dislocated from reality. The evidence is right in the economic data and bond market. So, I will ask one last time, what is the stock market looking forward to?
Author

Ryan Miller
Ryan Miller Trading Economics
Ryan Miller received a Bachelors Degree in History from William Paterson University. Through his studies of U.S. history, he developed an interest in the implications the financial markets have on the economy.


