Sterling’s rally is not built to last
Sterling’s rally has been driven more by positioning, carry and potentially some M&A flows than by a lasting improvement in UK fundamentals. With UK short-dated rates likely to drift lower and fiscal risks set to return ahead of the autumn, we expect sterling to hand back recent gains. Our central view remains for EUR/GBP to rise towards 0.88 by year-end.
Not driven by a UK re-rating
Sterling has had a pretty good summer so far. Even though it is off recent highs, sterling has still managed to rally about 2% against the euro over the last month and has generally performed well against a strong dollar.
Normally, a sustained rally in sterling would be driven by some good news – be it on growth, relative rate differentials, fiscal improvements or just capital inflows. It’s hard to pick out anything concrete here, but justifying sterling’s rally on a perceived fiscal improvement – for example, Andy Burnham’s choice of chancellor – looks wide of the mark.
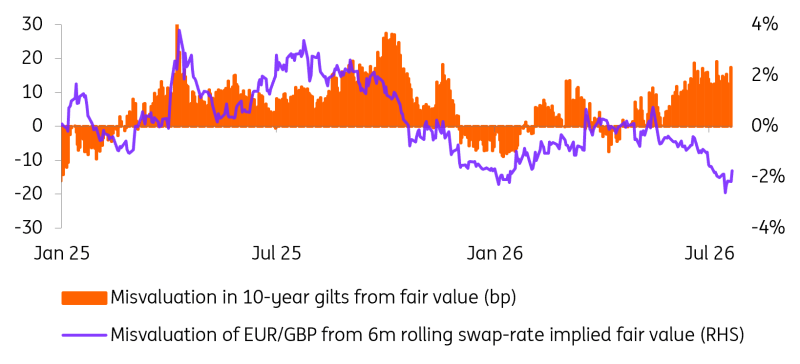
Below we show a relationship between the UK risk premium embedded in the gilt market versus that embedded in the FX market. Through 2025, both 10yr gilt yields and EUR/GBP traded above levels normally associated with common financial variables. While that risk premium has remained in gilts for most of 2026, it has evaporated in sterling. As a result, this sterling rally is not a classic re-rating story.
Risk premium remains in gilts, not sterling
Positioning explains more than fundamentals
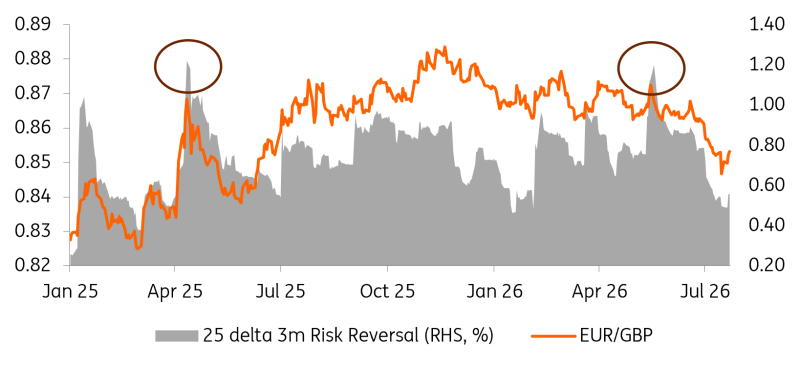
A better explanation of the sterling rally – one which appeals to us much more – is the combination of a short squeeze and some one-off flows. On the former, it looked like speculators had turned exceptionally bearish on sterling ahead of UK local elections in early May on the (correct) assumption that poor results would spell the end of Prime Minister Keir Starmer’s premiership. That bearish sterling sentiment can best be seen in the FX options market, where the risk reversal – the cost of buying a EUR/GBP call over an equivalent put option – rose to the most expensive levels seen since April 2025. That was when global financial markets were in turmoil after President Donald Trump’s ‘Liberation Day’ tariffs.
Sterling failed to sell off in the immediate aftermath of those election results, and we suspect a combination of sterling’s relative high risk-adjusted yields in quiet summer markets and potentially some large one-off sterling buying flows caught the market exceptionally short. In terms of those flows, there has been speculation that M&A activity could be in play.
EUR/GBP versus three-month risk reversal
The M&A story is probably being overstated
Connecting M&A activity with currency moves is typically a thankless task – particularly when this cross-border activity can be FX-hedged, can be spread over many months and can be locally funded. Yet the available data does suggest there has been a huge pick-up in UK targeted M&A flows this year on the view that UK corporates are cheap.
Current price earnings multiples for the FTSE 250 trade at a steep discount to the S&P Euro index (around 180 names) and announced UK inbound inflows are running at record highs. Announced flows into the UK dwarf anything seen in continental Europe, with UK deals focusing on Financials (Schroders, Beazley, Allfunds Group), Consumer Staples (Food assets/Unilever) and Industrials (Intertek, Rotork).
UK versus Eurozone P/E multiples and UK M&A inflows
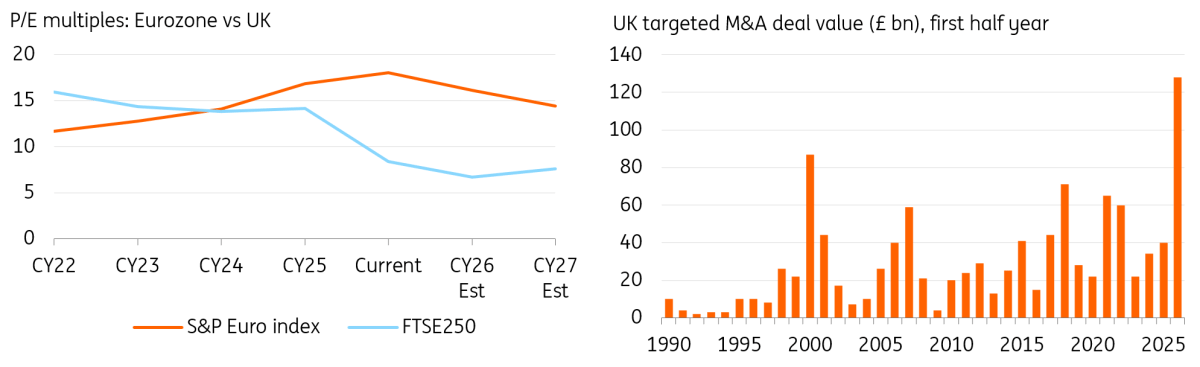
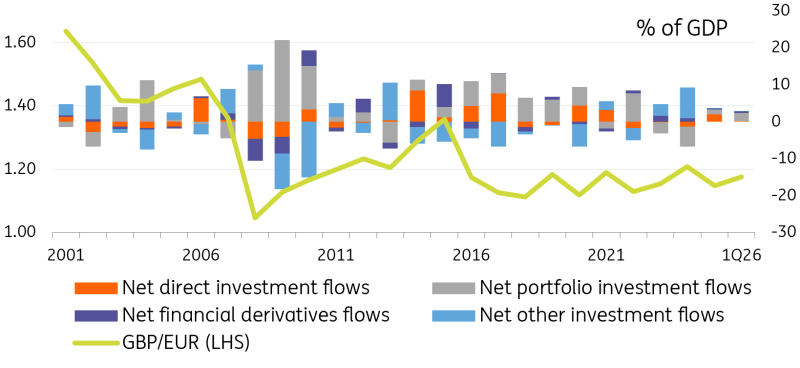
Pending and completed deals for UK companies this year add up to a staggering £220bn on some measures. But what we would say is that, over the last 25 years, net portfolio flows have on average been nearly five times larger than net direct investment flows. This can be seen below when looking at financial account flows as a % of GDP.
While M&A flows may occasionally grab the headlines in currency markets, they rarely drive sustained moves in currencies.
UK net investment and portfolio flows versus GBP/EUR
The real driver ahead is the Bank of England
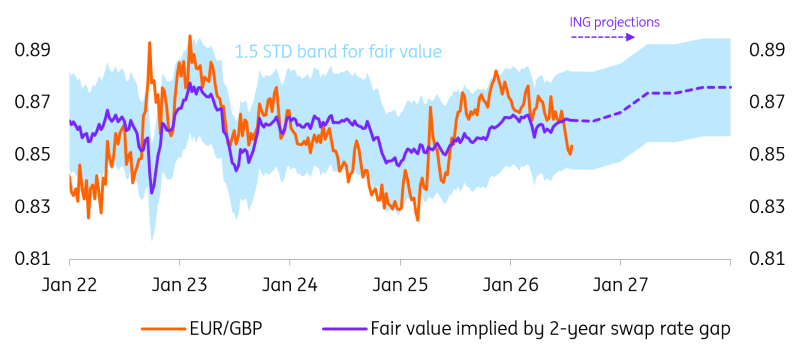
What typically explains currencies is relative growth trends and what they mean for the monetary and fiscal mix. Coming back to basics, EUR/GBP has lacked a sustained trend since 2022, but interest rate implied fair value has consistently acted as an anchor around 0.86. The fair-value estimate is derived from a 10-year weekly relationship between EUR/GBP and the EUR:GBP 2Y swap spread, providing a stable benchmark against which to assess valuation. As shown in the chart below, periods of substantial over- and undervaluation have typically reversed over time.
The pair currently sits close to the lower edge of the 1.5-standard-deviation valuation band, suggesting limited downside potential barring a substantial swing in short-term differentials in favour of the pound. On the contrary, our swap rate forecasts imply a gradual rise in EUR/GBP fair value over the coming years. That is based on the house view that UK inflation looks, barring a much larger energy surge, unlikely to challenge the 4% area – the 4% threshold seen as the trigger for a Bank of England hike. An unchanged UK policy rate and one further European Central Bank hike to 2.50% is our house call over the next six to nine months.
Our call on rate spreads suggests EUR/GBP should trade higher from here. But what about the fiscal story? Could there be any surprises there?
Short-term rate differential is the medium-term anchor for EUR/GBP
Tight fiscal arithmetic becomes harder to ignore
Like much of Europe, there are plenty of reasons to be downbeat about the UK’s public finances. Spending pressures are growing – from defence to health and social care. Debt interest costs are high and rising, not helped by Britain’s large stock of index-linked bonds and increasing reliance on foreign investors (particularly hedge funds). The tax burden may be the highest in decades, but spending has risen more significantly as a share of GDP since 2019. And tax on wages – income tax and social security – is among the lowest in Europe as a share of average labour costs.
That said, the UK is also a rare example of a country undergoing some meaningful fiscal consolidation. Since 2021, the tax thresholds have been frozen in cash terms. And subsequent waves of inflation have dragged more and more people into higher tax brackets, increasing tax revenues as a share of GDP. This fiscal drag is planned to continue over the remainder of this decade. And it’s a key reason why gilt issuance is falling significantly – from £303bn in FY2025 to £246bn in the current fiscal year.
In short, there’s a more positive near-term public finance story even if longer-term, it’s hard to see how borrowing doesn’t increase over and above current budget plans.
Over recent weeks, investors had become more relaxed about Burnham’s appointment, following his commitment to stick to the existing fiscal rules. In theory, that precludes a stimulus package this autumn that would either materially increase gilt issuance or change the calculus for the BoE. But Burnham’s recent openness to bigger changes – including lifting the tax-free allowance and greater funding for social care – means a bolder budget can’t be ruled out. Investors will be particularly sensitive to any headlines on tweaks to the fiscal rules in the run-up to Burnham’s first budget this October or November.
Sterling to hand back gains
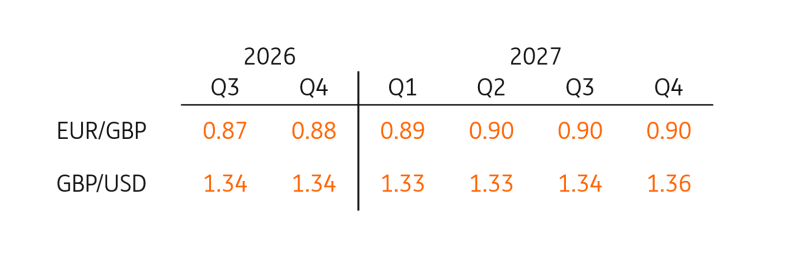
Sterling’s summer rally has come as a surprise to most, but it looks to be built on weak foundations. Into the autumn, we expect UK short-dated rates will be coming lower and the UK’s fiscal position will again be under scrutiny. That means EUR/GBP doesn’t need to spend too long down at these levels near 0.85 and we remain comfortable with our call for a move to 0.88 by year-end and a push to 0.90 in 2027. And based on our view that the Fed does not tighten in this cycle and the dollar softens, GBP/USD should continue to trace out a 1.32-1.36 range.
ING's forecasts for GBP
Author

ING Global Economics Team
ING Economic and Financial Analysis
From Trump to trade, FX to Brexit, ING’s global economists have it covered. Go to ING.com/THINK to stay a step ahead.

















