Sterling slips back as the dollar underperforms, gold bounces

Market Overview
There is a slightly more settled look to markets as the weekend approaches. With all of this week’s key Brexit votes in the UK Parliament have passed, it will be interesting to see if sterling begins to settle down. Initially as European traders take over this morning, a degree of selling pressure has taken hold, although this is so far nowhere as severe as other moves earlier in the week. Buy on rumour, sell on fact perhaps? Yesterday, MPs voted to instruct the UK Government to apply for an extension to the Article 50 process beyond the deadline of the 29th March. This means that whilst all options still remain possible, the likely move towards a softer form of Brexit, or no Brexit at all is growing. Away from Brexit, reports out of North Korea suggest that there could be a breakdown in the discussions over nuclear disarmament and this is helping to support safe haven plays this morning. Gold has found a bid, whilst it is also interesting to see that with Treasury yields are slipping back, which is leading to the dollar just starting to underperform slightly, although only marginally at this stage. The Bank of Japan monetary policy decision was as anticipated (no change at -0.1% expected), with little change to ay rate whilst keeping a cautious view of inflation and sluggish growth and leaving the door open for further easing measures.

Wall Street closed another cautious session yesterday slightly weaker on the S&P 500 -0.1% at 2808, whilst US futures are advancing today by +0.2%. This has helped Asian markets move higher overnight with the Nikkei +0.8% and Shanghai Composite +1.0%. European markets are following US futures higher, with FTSE futures and DAX futures around +0.2% higher. In forex trading, sterling is coming under some corrective pressure this morning, but aside from that there is a sense of mild dollar correction. This is helping to lend support to commodities, with gold and silver both bouncing after yesterday’s decline, whilst oil also continues to climb.
Traders will be looking out for the final reading of February Eurozone inflation at 1000GMT with final Eurozone headline HICP expected to be confirmed at +1.5% (+1.5% prelim, +1.4% final January), with the final Eurozone core HICP for February expected at +1.0% (+1.0% prelim, +1.1% final January). US Empire State Manufacturing (New York Fed) is at 1230GMT and is expected to improve slightly to +10.0 (from +8.8%). US Industrial Production for February is at 1315GMT and is expected to grow by +0.4% on the month (-0.6% in January) with Capacity Utilization expected to improve and is expected to improve to 78.4% (from 78.2% in January). The prelim University of Michigan Sentiment is at 1400GMT and is expected to improve to 95.5 (from 93.8 final January) and finally the US JOLTS jobs openings are at 1400GMT and are expected to slip slightly to 7.31m (from 73.4m in December).
Chart of the Day – Silver
We discussed recently about the prospects for a recovery on Silver, but there has been a profound failure of this recovery in just one big bear candle. The technical analysis of this move, and arising from this move, will be a real concern for the bulls if this is confirmed now. The failure to close above the $15.46 pivot (the old February low) has come with the failure of the RSI around 50 (which was seen as a floor throughout the December to February period). The result of this means that the MACD lines are threatening to bear kiss lower, whilst the Stochastics are crossing lower around 40 in bearish configuration. There has been a key reaction back higher again this morning from another old support at $15.14. suggests that how the market moves outside this band of $15.14/$15.46 is now key. Also the response on momentum indicators for the medium term perspective. A close below $15.14 would increase concern now and open a test of what is a crucial support at $14.90. The failure around $15.46 means that this is an increasingly firm resistance area now and the deterioration on momentum suggests that rallies are a struggle and seem to be a selling opportunity.

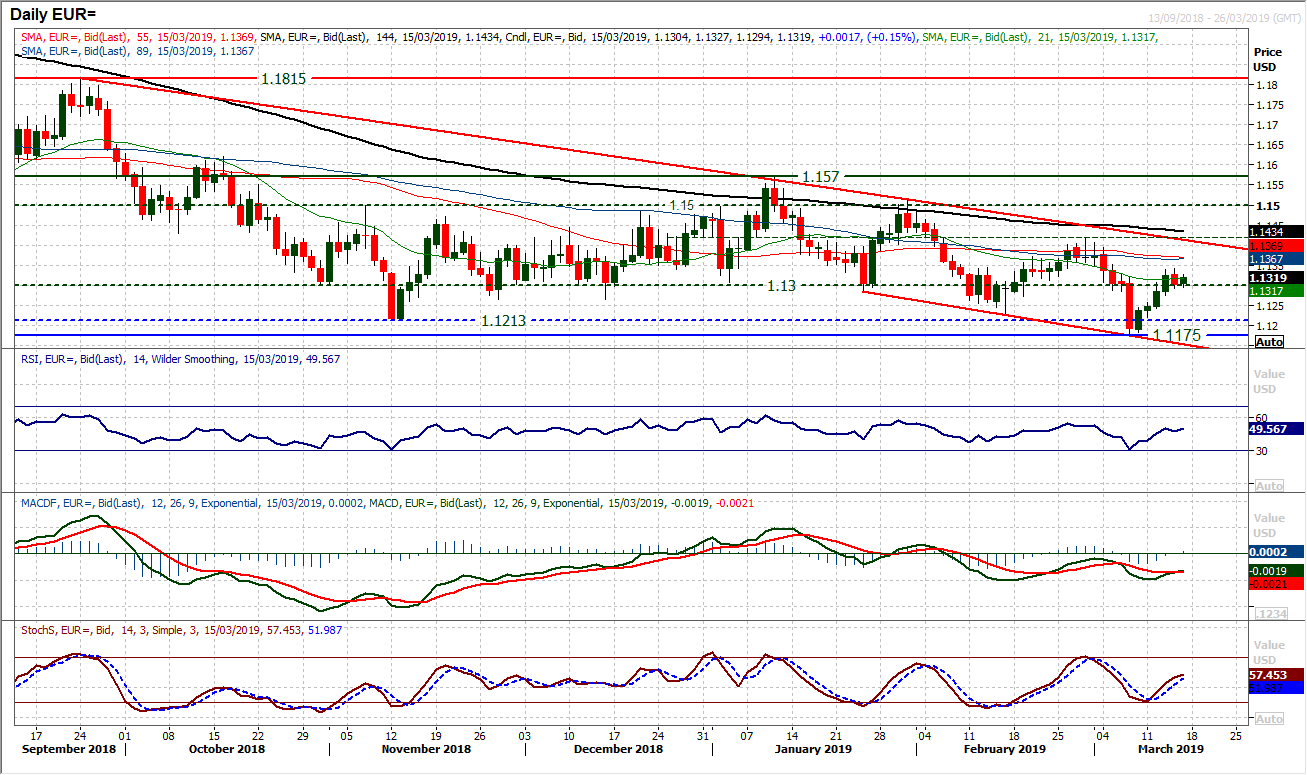
The break back above $1.1300 has helped to improve the near term outlook on the euro, but this move needs to hold. Yesterday’s negative candle tested this support but it held on a closing basis and whilst this remains the case the bulls will be encouraged. The concern is that the momentum indicators retain a negative bias on a medium term basis, whilst the market is still in this downtrend channel phase which is a drag. It suggests that near term rallies are struggling to maintain traction now. Is this a chance to sell? On the balance it is likely to be the case, but the support of the old key floor around $1.1300 will be watched. If yesterday’s negative candle begins to develop into more negative candles, then the selling momentum will likely take off again. The key resistance to break this sequence remains the lower reaction high at $1.1420. Initial resistance at $1.1340. The RSI continuing to fail under 50 would be a sign too. The hourly chart shows a near term recovery uptrend is intact, but support at $1.1290 and a higher low at $1.1275 need to hold.
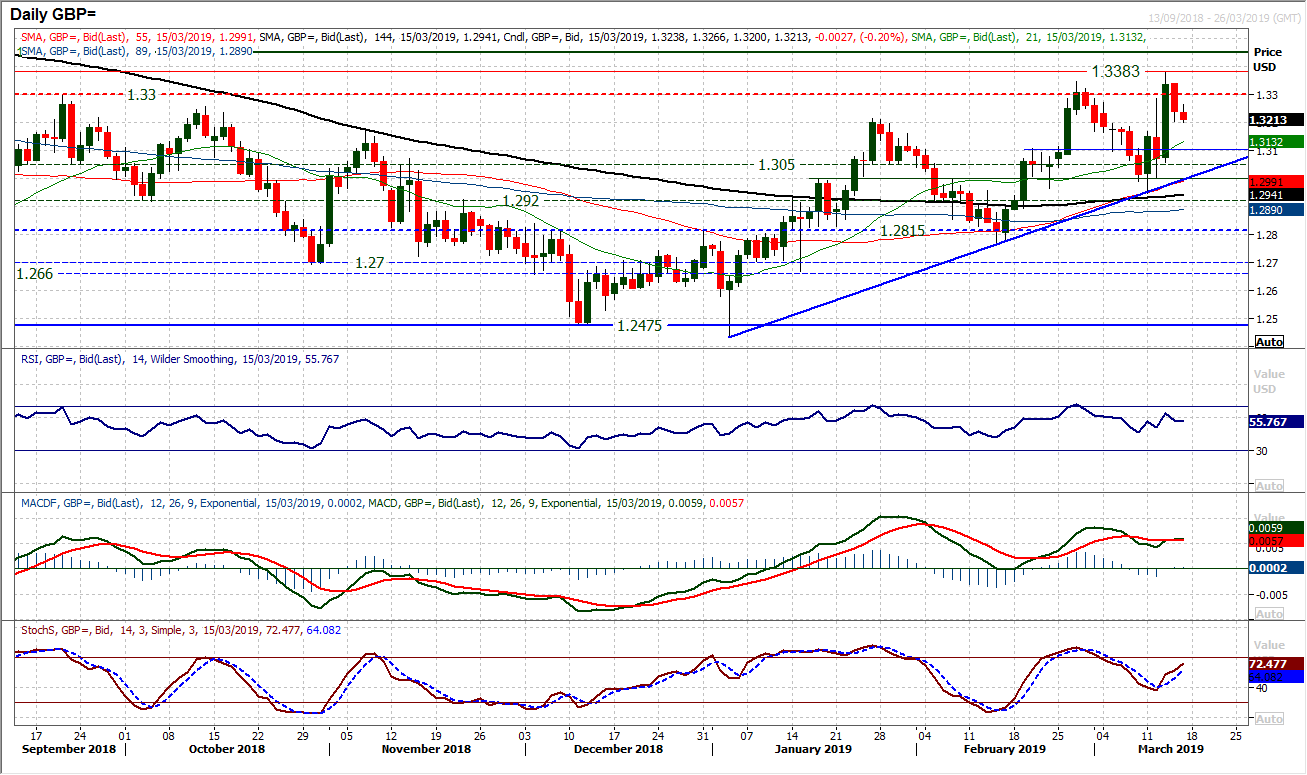
It has been a wild ride on Cable throughout this week with the series of votes on Brexit creating huge volatility. However, with that now behind us (at least for a few days) perhaps the market can begin to settle down a bit. This morning’s consolidation seems to be just that. Technically, there is a basis of support above $1.3200 now, whilst the hourly chart does continue to show consistent basis of pivots around the 50 pip increments, with $1.3150, $1.3100 and $1.3050 all recent turning points. Momentum is still tracking positively and it seems that weakness is a chance to buy still. However, the question is whether after all the volatility and upside, there could now be a corrective drift that sets in. The support levels at $1.3200 and $1.3150 could be the first tests.
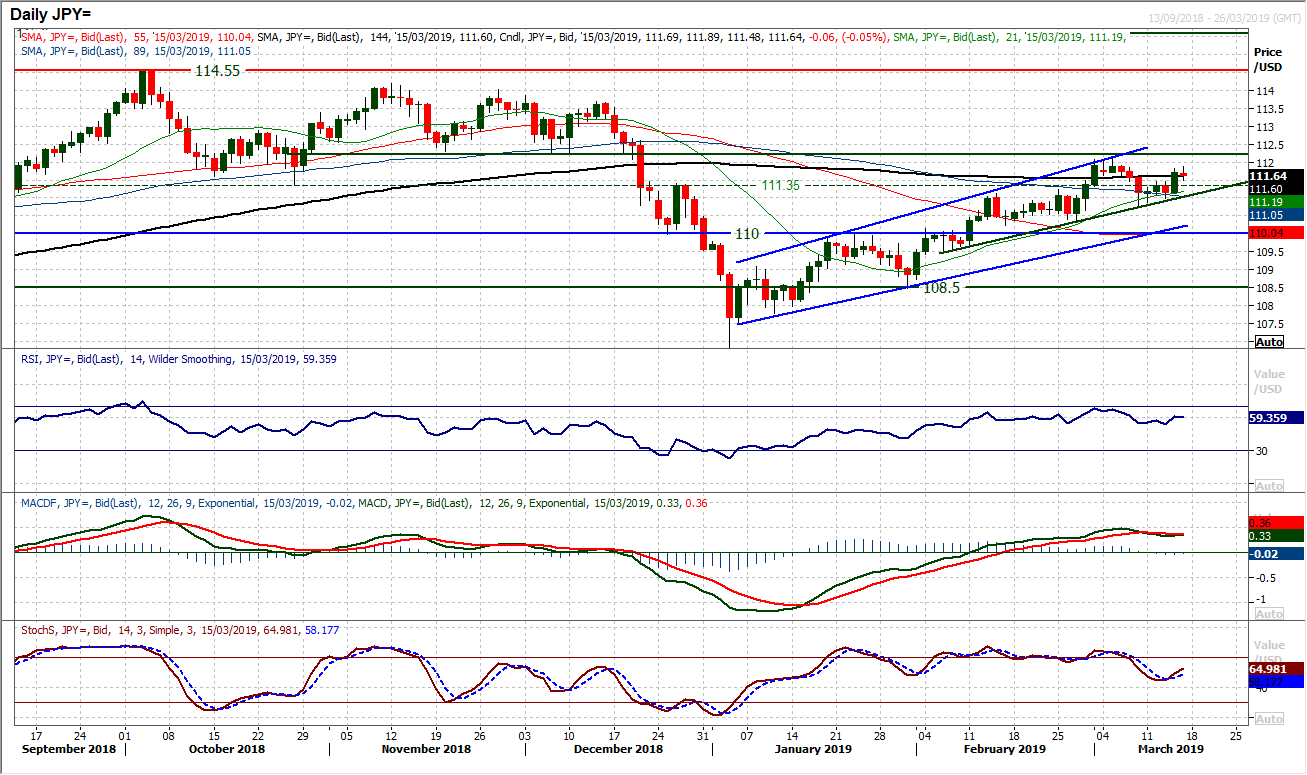
After a run of neutral and subdued candlesticks, a solidly positive move yesterday has helped to improve the outlook once more. There has been limited reaction to the Bank of Japan monetary policy decision overnight, but there is a sense now that weakness within the uptrend channel is a chance to buy. Momentum indicators are ticking positively once more (albeit still rather constrained), with the Stochastics crossing back higher and RSI back around 60. The hourly chart shows the market now using the near term pivot band 111.45/111.60 as support and the bulls will be keen for this to continue. A test of the March highs around 112.10 is still preferred, with the overhead supply increasing at 112.25. Support at 110.75 is increasingly important for the continuation of the positive outlook.
Gold
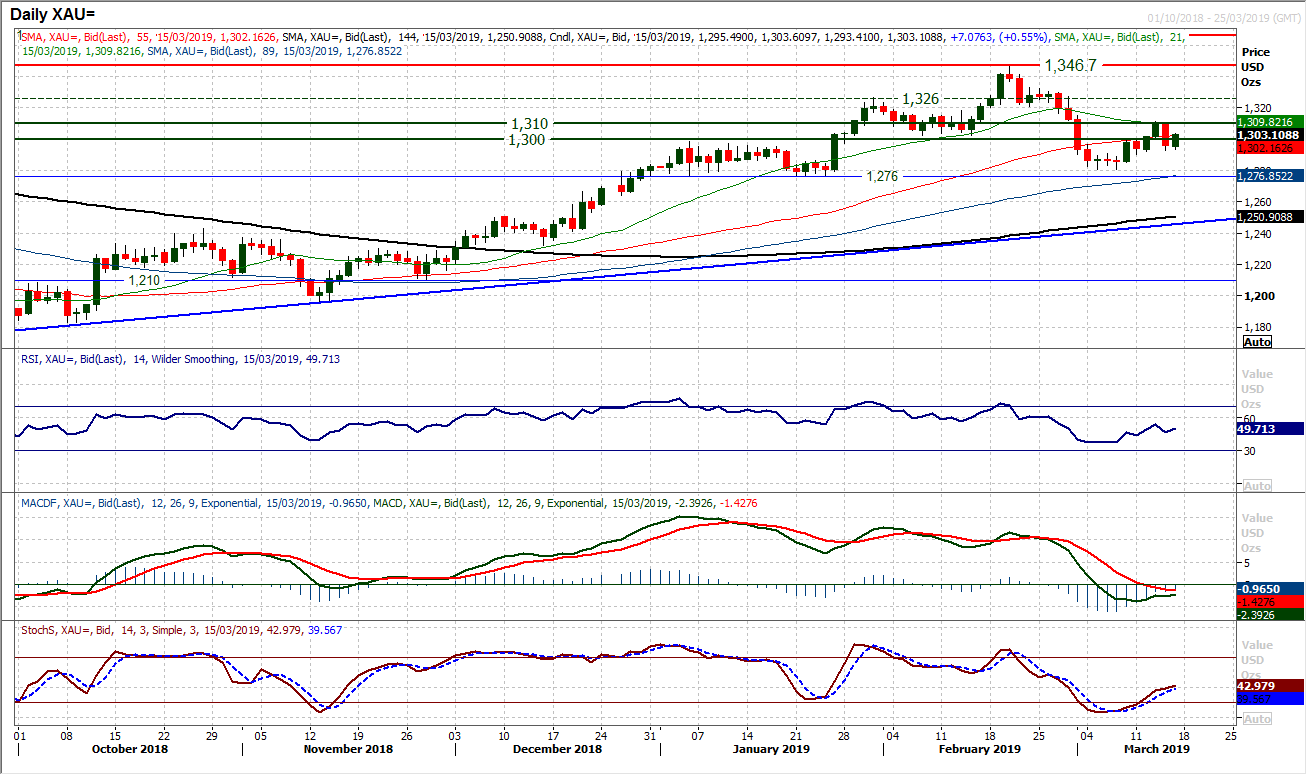
The bulls will have been shocked at the alarming and sudden selling pressure that formed a strong bear candle yesterday. The technical implications of this could also be profound if the bulls do not themselves respond quickly. The failure to breakout above $1310 on a closing basis (the intraday high from Wednesday’s session was $1311) along with a subsequent failure of a near term higher low support at $1300 means that the renewed bull recovery is now seriously being questioned. The failure of the RSI in the low 50s (where the December to February lows tended to be seen) is a worrying development and unless this can be rectified then the selling pressure would increase. The importance of the support at $1276 and $1280 is significant, whilst the hourly chart shows initial support at $1290 needs to be watched. How the bulls respond today could be crucial to the outlook now. Initially the move is testing $1300 and a failure to close above this level would increase the pressure. The importance of a breakout above $1310 for the bulls continues to grow. Initial support at $1292.50.
WTI Oil
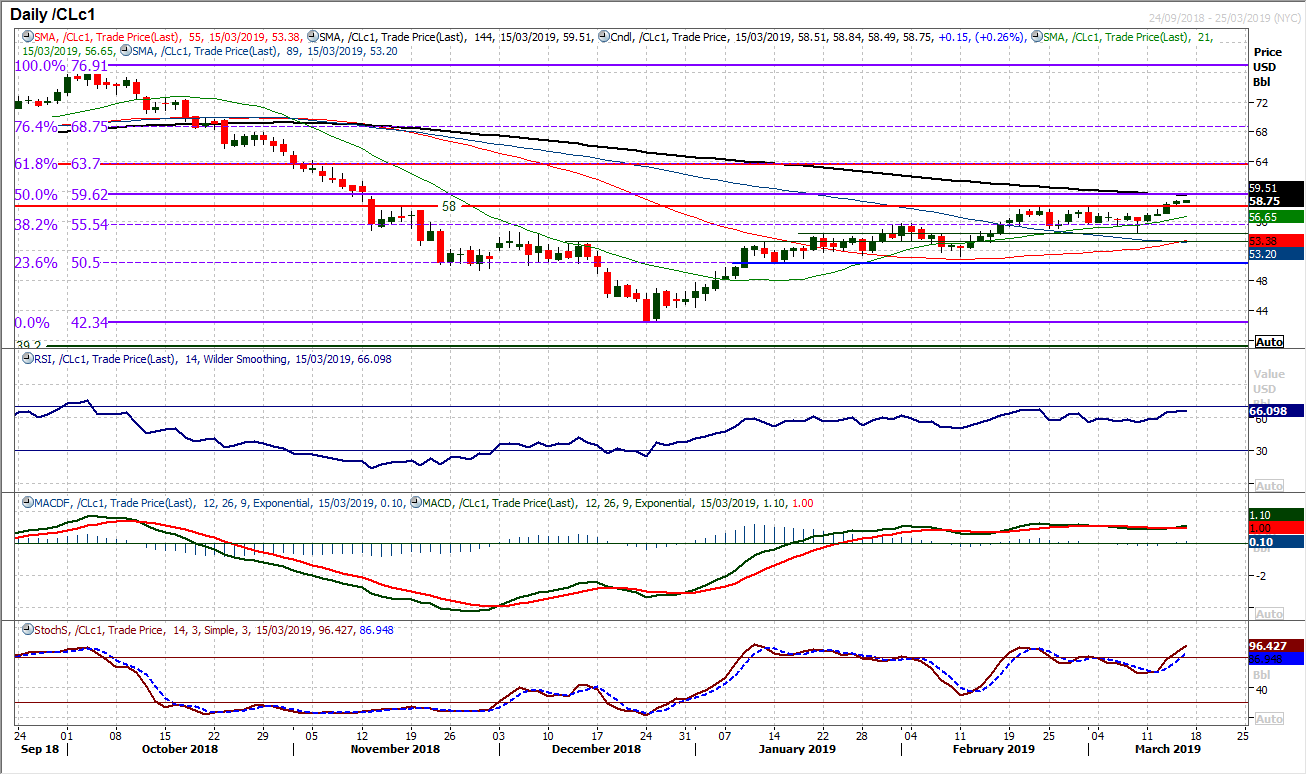
Given the breakout above the key resistance of the medium term pivot at $58.00, the market is building for an increasingly positive outlook. Yesterday’s very small candle did little to advance the recovery and was more of a consolidation of the breakout but another close above $58.00 is still encouraging. The strength of momentum indicators now with the RSI decisively above 60 and Stochastics pulling into a strong position, shows that weakness is now a chance to buy. The hourly chart shows a series of old breakout resistance is now supportive between $57.50/$58.00 and is a near term “buy zone” on a technical pullback. Consistent closing above $58.00 opens the upside once more, with a $3.50 consolidation range upside breakout target of $51.50 in the coming weeks. The 50% Fibonacci retracement at $59.60 is initial resistance now and a potential area of the next consolidation. The breakout above $58.00 now means that $54.50 is now seen as a key higher low in the recovery.
Dow Jones Industrial Average
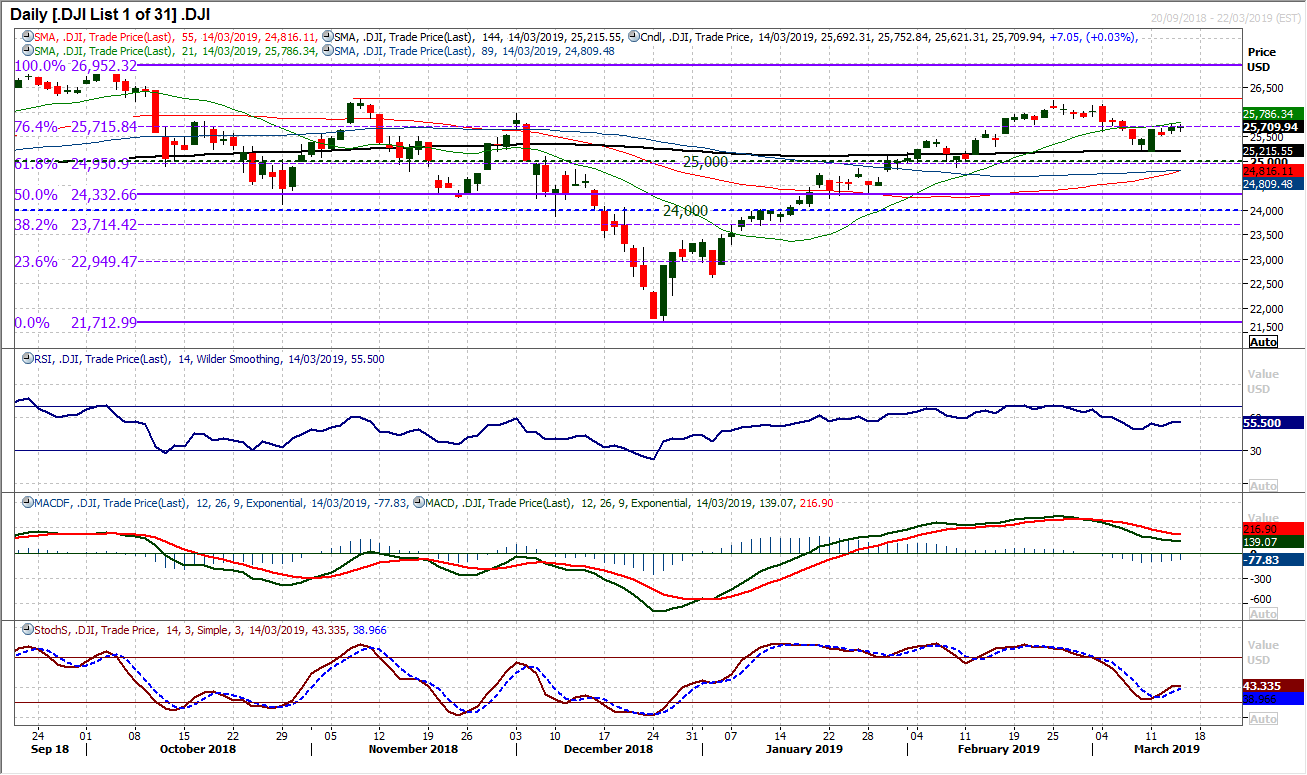
One more the Dow continues to consolidate around the 76.4% Fibonacci retracement of the 26,952/21,713 sell-off. It certainly seems as though the Dow is gravitating towards this 25,715 level for now. A neutral candle with a small daily range and minimal real body reflects a lack of conviction now and means that the market has done very little for the past three sessions. There is a mildly positive bias on momentum with RSI and MACD lines still above their neutral points but the bulls have struggled recently. Initial resistance is 25,776 with a lower reaction high at 25,877 to overcome. Trading entirely clear of the 76.4% Fib would also help the bulls. Support at 25,522 protects the key reaction low at 25,208.
Author

Richard Perry
Independent Analyst


