S&P 500 at Resistance Level, Downward Correction Ahead?

Stocks went slightly up yesterday, as investors' sentiment remained bullish following the recent advances. The S&P 500 index extended its short-term uptrend, before closing just 0.2% higher. Is this a short-term topping pattern or just another consolidation within an uptrend?
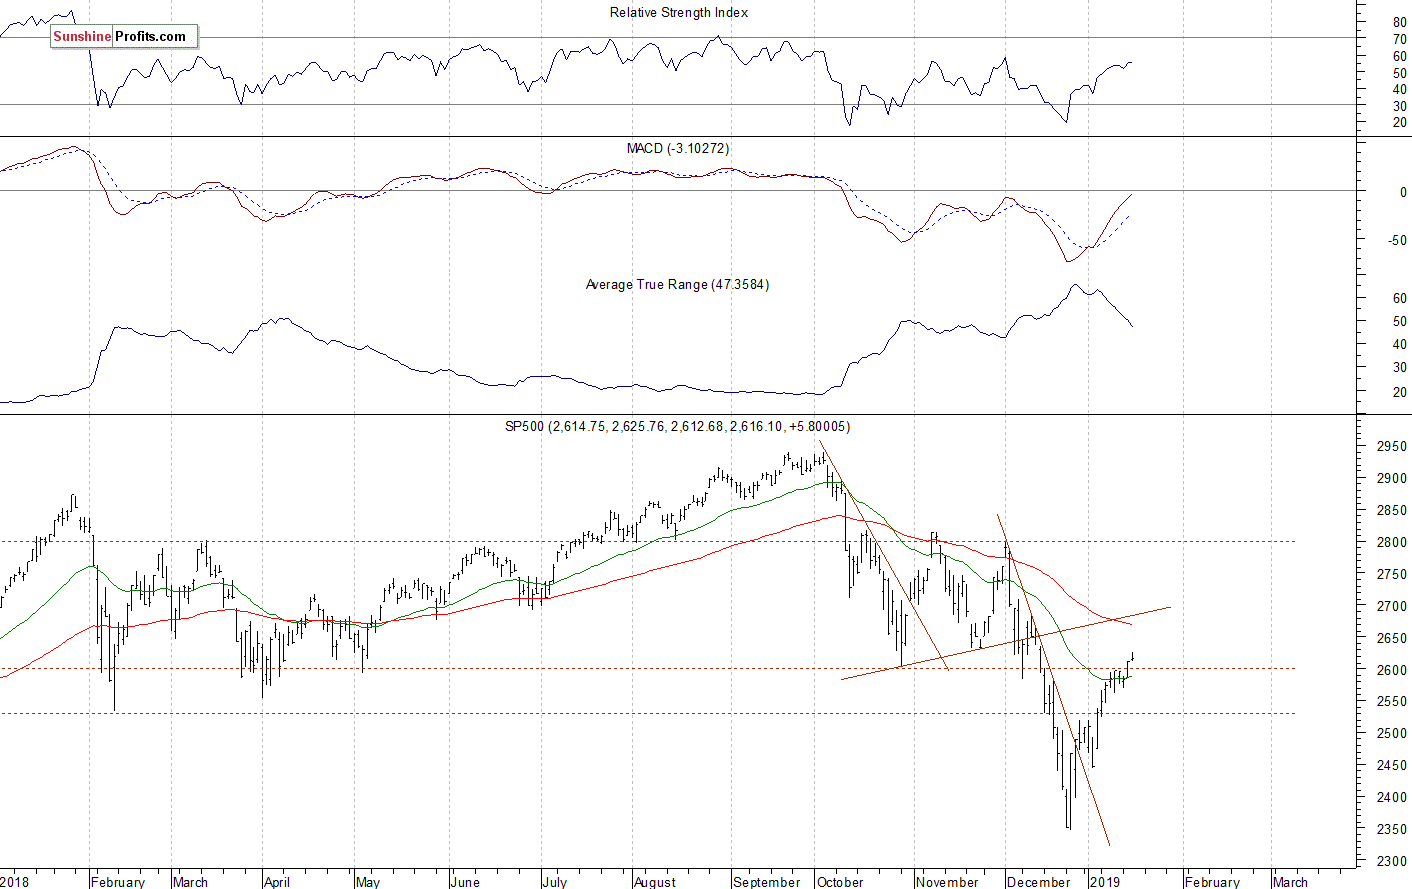
The U.S. stock market indexes gained 0.2-0.6% on Wednesday, extending their short-term uptrend, as investors' sentiment remained bullish ahead of the quarterly earnings releases. The S&P 500 index continued its rebound off the December the 26th medium-term low of 2,346.58. The index traded 20.2% below September the 21st record high of 2,940.91 on that day. Then the market rallied and retraced almost 50% of the downtrend. It broke slightly above 2,600 mark on Tuesday. The Dow Jones Industrial Average gained 0.6% and the Nasdaq Composite gained 0.2% yesterday.
The nearest important level of resistance of the S&P 500 index is at 2,635-2,640, marked by December the 14th daily gap down of 2,635.07-2,637.27. There is also a resistance level of 50% retracement of the whole downtrend from the mentioned September's record high at 2,643.7. The next resistance level is at 2,675-2,685, marked by the early December local highs. On the other hand, the level of support is at 2,580-2,600, marked by the recent resistance level. The support level is also at 2,550-2,570.
The broad stock market broke below its two-month-long trading range in the mid-December, as the S&P 500 index fell below the level of 2,600. Then the market accelerated lower and it broke below the level of 2,400. The downward correction reached 20.2% from the September all-time high, surpassing January-February correction of around 12%. Is this a long-term bear market? It still looks like a medium-term downward correction. And the index retraces almost 50% of its December sell-off, as we can see on the daily chart:
Slightly Negative Expectations
The index futures contracts trade 0.2-0.3% below their yesterday's closing prices. So expectations before the opening of today's trading session are negative. The European stock market indexes have lost 0.3-0.5% so far. Investors will wait for some economic data announcements today: Philadelphia Fed Manufacturing Index, Initial Claims at 8:30 a.m. Investors will also wait for more quarterly corporate earnings releases. The broad stock market will likely fluctuate following the recent advance. If the index breaks below 2,600 mark, we could see some more profit-taking action.
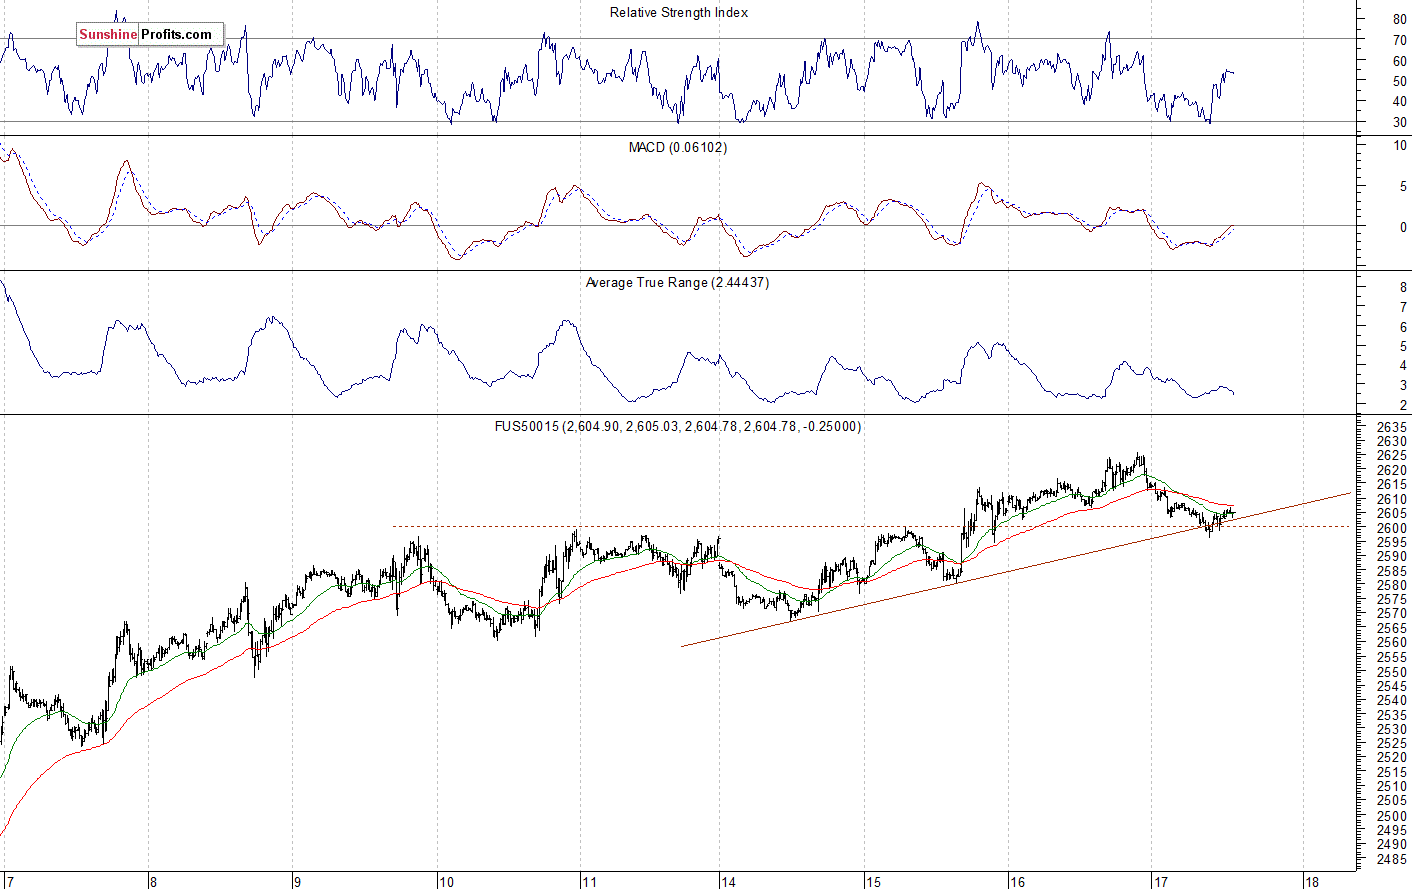
The S&P 500 futures contract trades within an intraday consolidation, as it fluctuates following an overnight decline. The nearest important level of support is at 2,595-2,600, marked by the local low. The support level is also at 2,580. On the other hand, the resistance level is at 2,620-2,625, marked by the local high. The futures contract is at the short-term upward trend line, as the 15-minute chart shows:
Nasdaq Also Lower
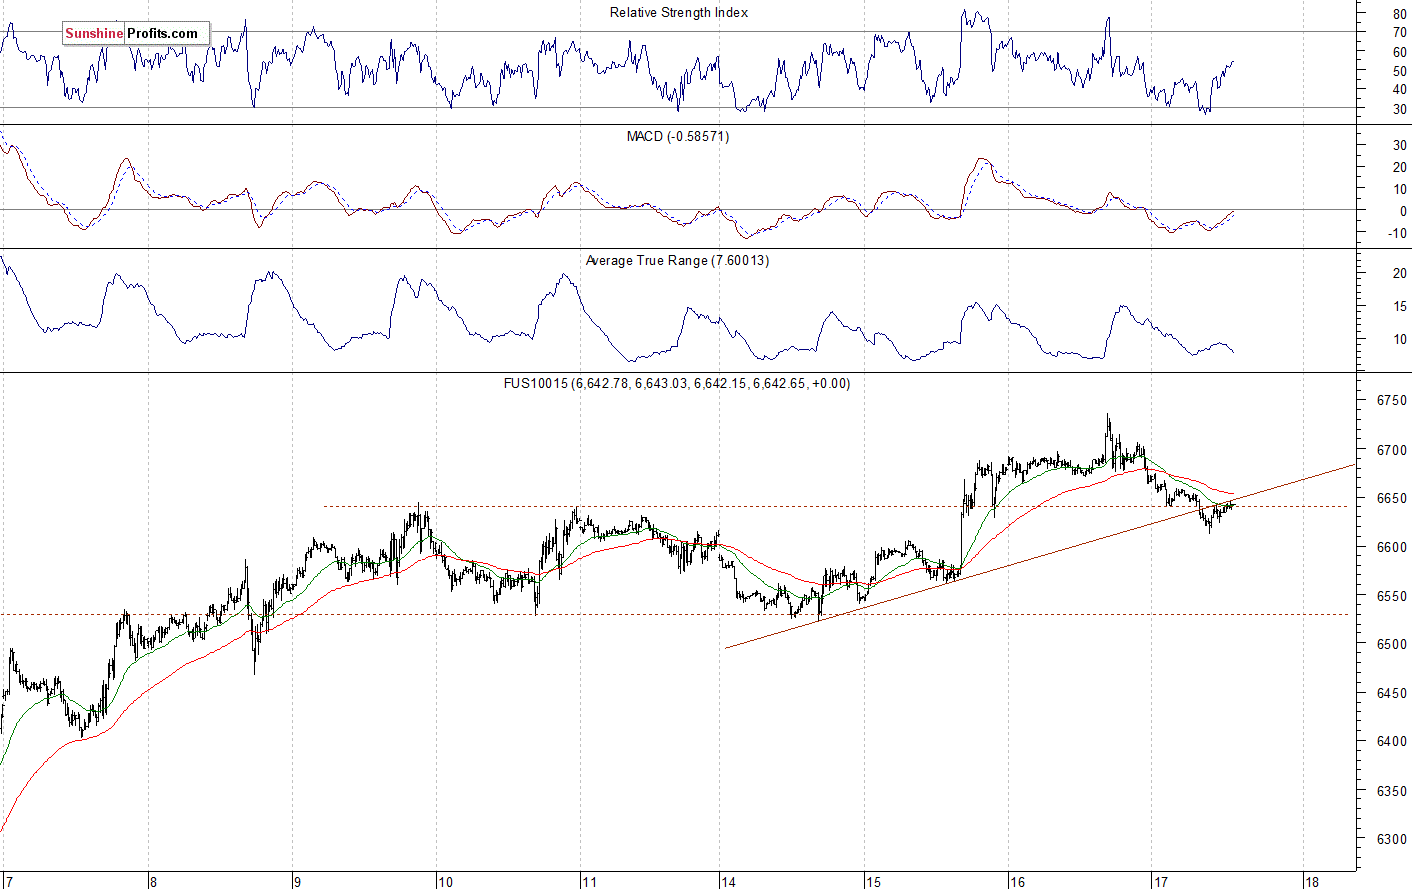
The technology Nasdaq 100 futures contract follows a similar path, as it trades within an intraday consolidation. It broke above 6,700 mark yesterday, following the recent breakout above 6,600. It gained more than 900 points from December the 26th local low of around 5,820. The Nasdaq futures contract trades along its previous local highs this morning, as we can see on the 15-minute chart:
Tech Stocks Advancing, Still Just Correction?
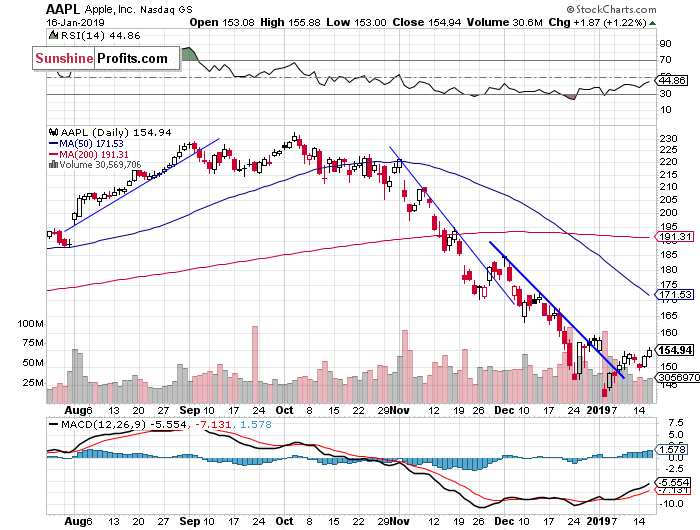
Let's take a look at Apple, Inc. stock (AAPL) daily chart. The stock sold off in the early January, as it reached the new mediumterm low of $142. We saw clear short-term oversold conditions and then the stock retraced some of its recent decline. It broke above the month-long downward trend line, but it remains slightly below the resistance level of $155-160:
Now let's take a look at Amazon.com, Inc. stock (AMZN) daily chart. The stock accelerated its downtrend in the late December and it reached the new medium-term low of $1,307. Since then it was consequently advancing. On Tuesday a week ago the market reached its threemonth- long downward trend line. Recently we wrote that "we may see an attempt at breaking higher" And it seems that the market broke higher, but there is a resistance level at around $1,700-1,750:

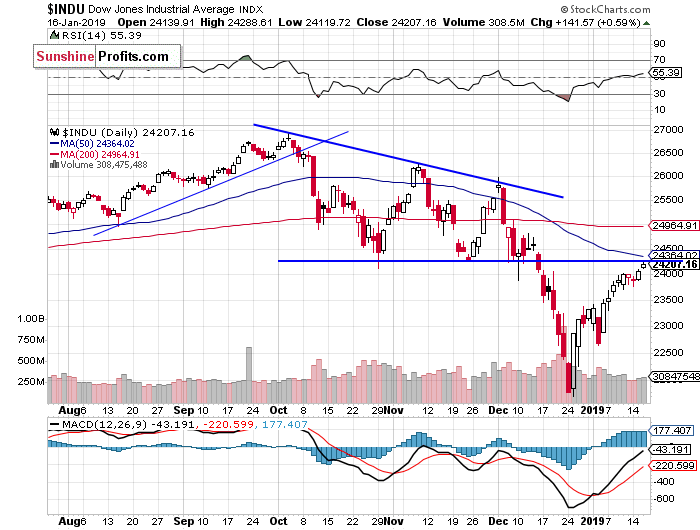
Dow Jones at Resistance Level
The Dow Jones Industrial Average broke below its two-month-long consolidation in the mid- December and then it accelerated much lower. The blue-chip stocks' gauge fell below the level of 22,000. It slightly extended the downtrend in the late December, before sharply reversing higher and getting back to 24,000 mark. The market is now at its October - December trading range after retracing its post-breakdown sell-off:
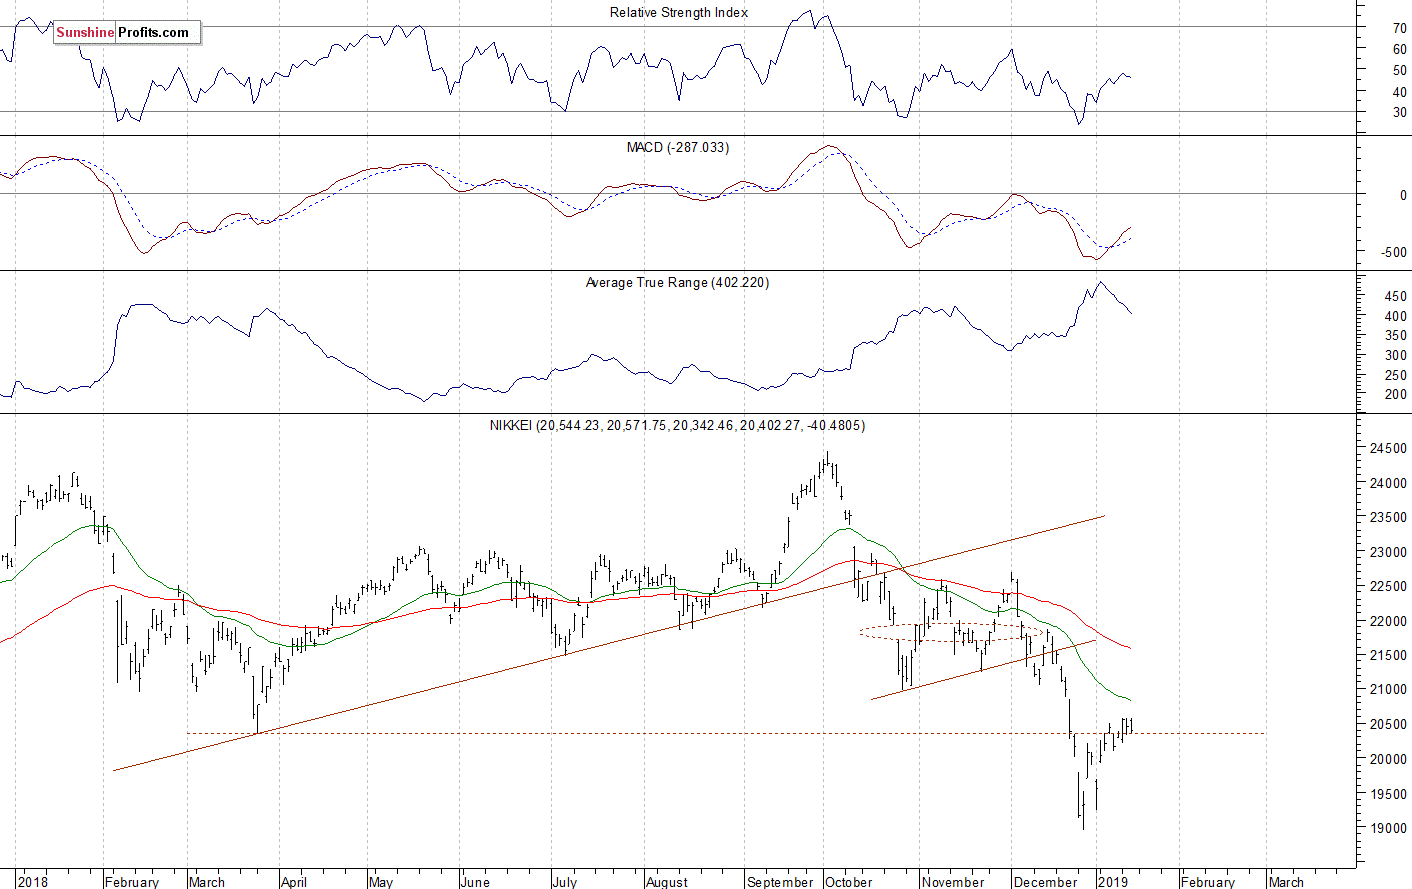
Japanese Nikkei - Short-Term Consolidation
Let's take a look at the Japanese Nikkei 225 index. It accelerated the downtrend in the late December, as it fell slightly below the level of 19,000. Since then it was retracing the downtrend. A week ago we saw an advance above the level of 20,000. For now, it still looks like an upward correction:
The S&P 500 index extended its downtrend in the late December, before reversing higher. The broad stock market was more than 20% below its September's record high on December the 26th. Is this a new long-term bear market or just medium-term downward correction? It still looks like a correction. The market retraced some of its recent decline, however, it continues to trade at the relatively important resistance levels.
Concluding, the S&P 500 index will likely open lower today and we may see some profittaking action. The market slightly extended its short-term uptrend yesterday following Tuesday's breakout above the level of 2,600. Investors will now wait for more quarterly corporate earnings releases.
Want free follow-ups to the above article and details not available to 99%+ investors? Sign up to our free newsletter today!
Author

Paul Rejczak
Gold Price Forecast
Paul Rejczak is a stock market strategist who has been known for the quality of his technical and fundamental analysis since the late nineties.


