This weekend the S&P 500 Index reached a significant level hitting the 1.618 fibonacci expansion of the move up from the December 2018 low and the subsequent high at a price of 3329.
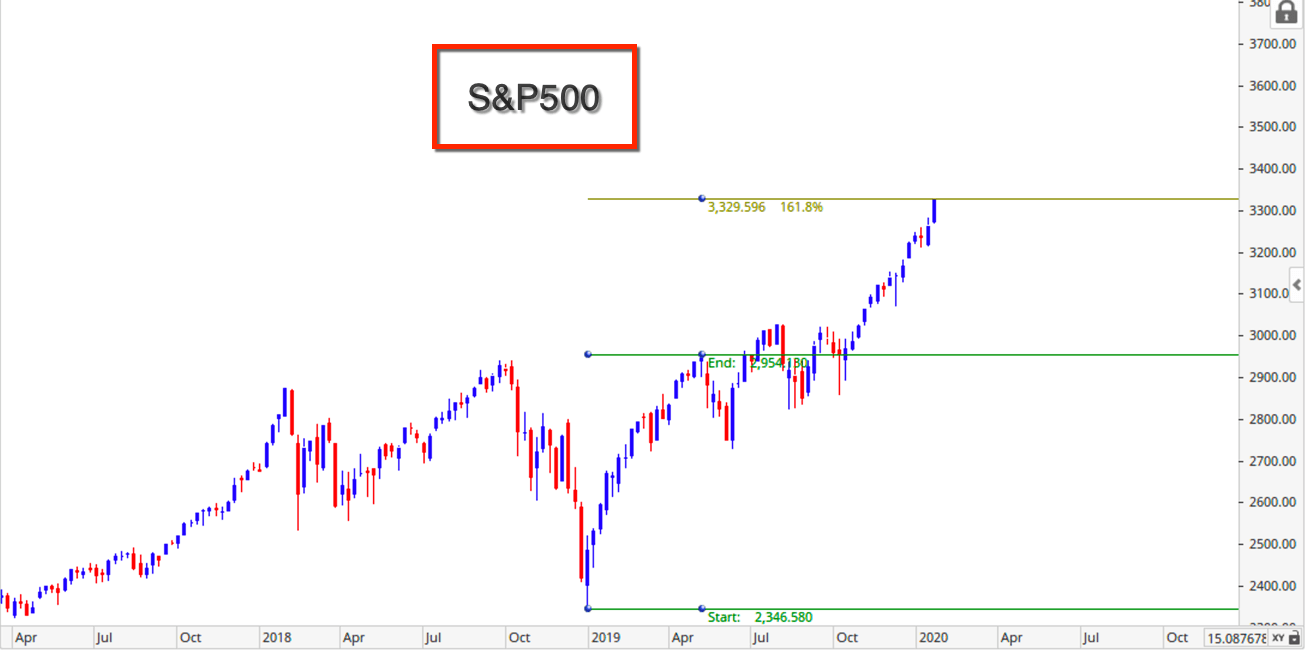
Here is a second interesting fact.
The low after the Global Financial Crisis came in at just over 667.
Multiplying that figure by 5 takes us to the levels shown in the chart below - 3327.
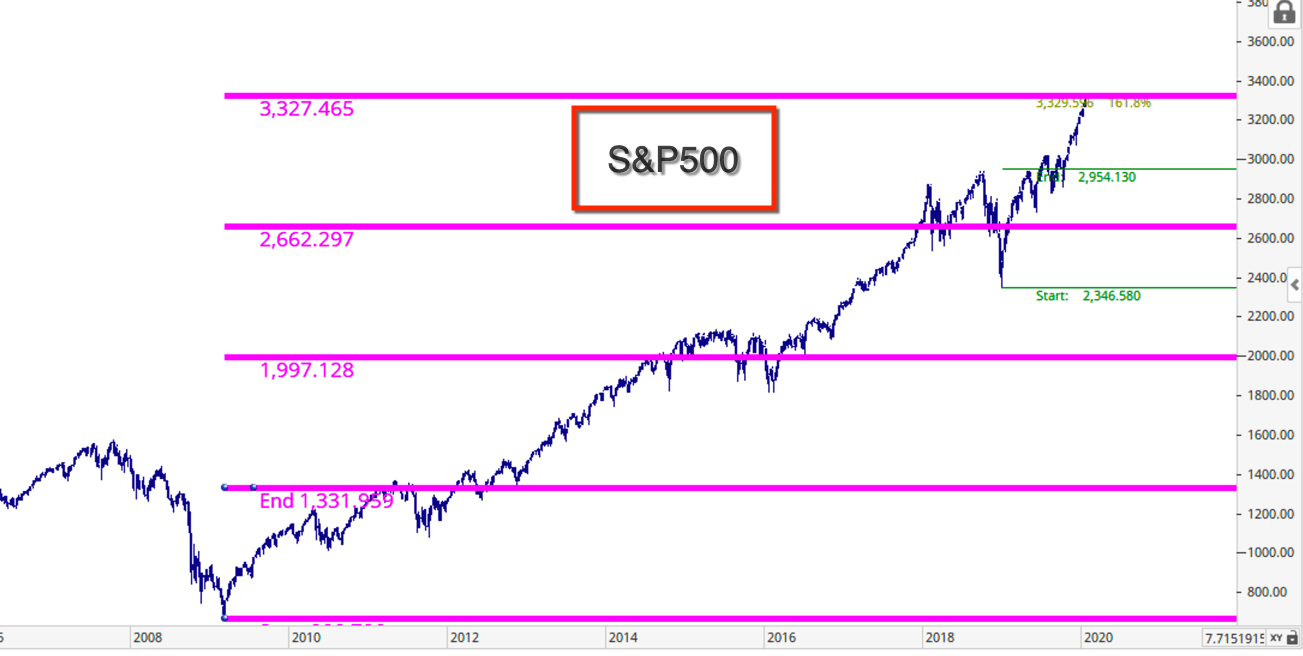
Both these levels were hit over the holiday weekend when we also had a Market Timing Report turning point.
If it wasn’t for the repo situation I would say we are at overhead resistance.
Watch the market carefully!
The Market Timing Report/Cycles Analysis Ltd is a research company. The information contained herein is for general education purposes and is not intended as specific advice or recommendations to any person or entity. Any reference to a transaction, trade, position, holding, security, market, or level is purely meant to educate readers about possible risks and opportunities in the marketplace and are not meant to imply that any person or entity should take any action whatsoever without first evaluating such action(s) in light of their own situation either on their own or through a professional advisor. If a person or entity does not believe they are qualified to make such decisions, they should seek professional advice. The prices listed are for reference only and are in no way intended to represent an actual trade, entry price or exit price conducted by The Market Timing Report/Cycles Analysis Ltd, portfolios managed by any entity affiliated with The Market Timing Report/Cycles Analysis Ltd or any principal or employee of The Market Timing Report/The Market Timing Report/Cycles Analysis Ltd . This information is not a substitute for professional advice of any nature, including tax, legal, and financial. While we believe the information contained herein to be accurate, all numbers should be verified by the reader through independent sources. Trading securities, options, futures, or any other security involves risk and can result in the immediate and substantial loss of the capital invested.
Recommended Content
Editors’ Picks
USD/JPY holds positive ground around 151.50 following Japanese CPI data
The USD/JPY pair holds positive ground for the second consecutive day near 151.45 on Friday during the early Asian trading hours. The cautious approach from the Bank of Japan to keep monetary conditions accommodative exerts some selling pressure on the Japanese Yen.
AUD/USD holds above 0.6500 in thin trading
The Australian Dollar managed to recover ground against its American rival after AUD/USD fell to 0.6484. The upbeat tone of Wall Street underpinned the Aussie despite broad US Dollar strength and tepid Australian data.
Gold price finishes Thursday’s session set to reach new all-time highs
Gold price rallied during the North American session on Thursday and hit a new all-time high of $2,225 in the mid-North American session. Precious metal prices are trending higher even though US Treasury yields are advancing, underpinning the Greenback.
Top 3 Price Prediction BTC, ETH, XRP: Retail watches from the sidelines with a bias for shorts
Bitcoin is showing strength as markets head into the Easter holidays. As it rises, altcoins are following suit, with Ethereum and Ripple posting almost similar gains. Meanwhile, there remains an unfilled CME Gap, with a lot of liquidity also resting above and below BTC price.
Bears have been standing before a steamroller so far this year
Despite a pushback on rate cuts from Christopher Waller, and what was supposed to be cautious trading sentiment ahead of critical US inflation data released later on Friday, the S&P 500 rose on Thursday, marking its best first-quarter performance in five years.