Silver - False Breakout

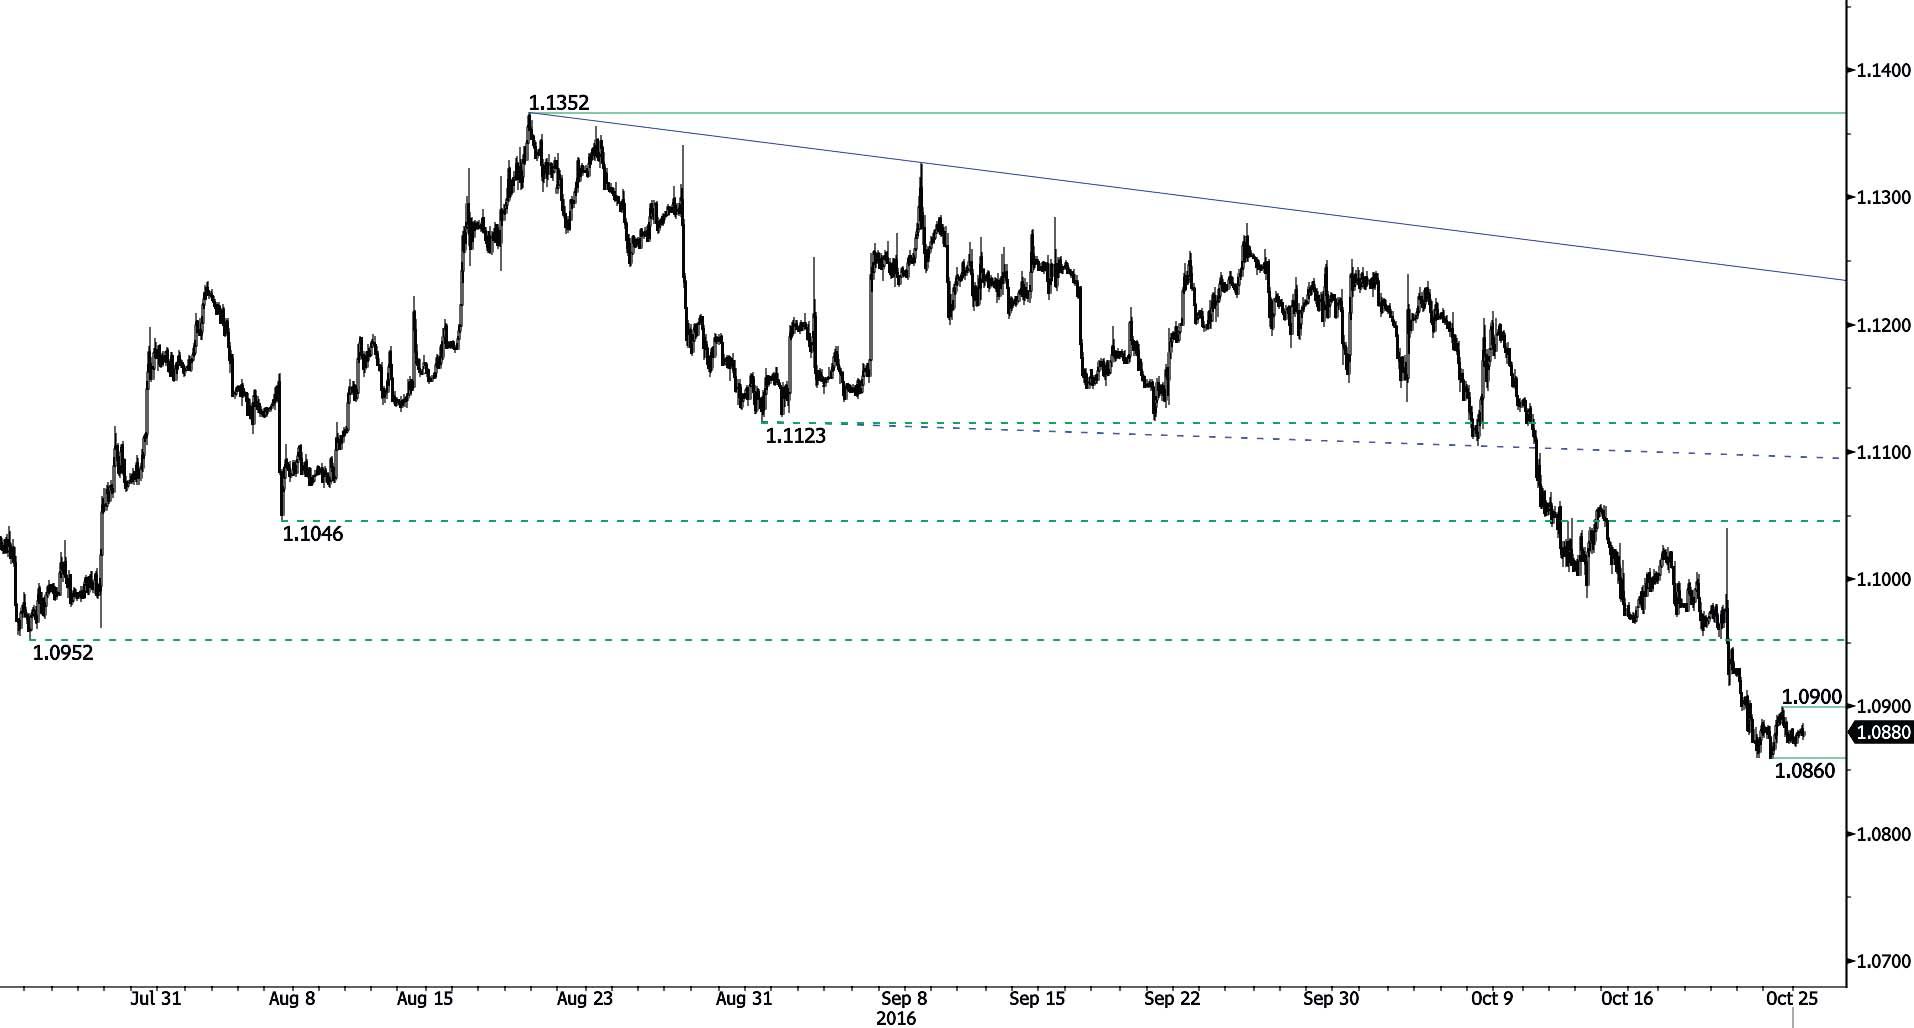
EUR/USD
Sideways price action.
-
EUR/USD's bearish momentum continues. Selling pressures are important. Resistance can be given at 1.0900 (24/03/2016 low) while stronger resistance lies at 1.1058 (13/10/2016 high). Key resistance is located far away at 1.1352 (18/08/2016 high). Expected to further weaken towards support at 1.0860 (24/10/2016 low).
-
In the longer term, the technical structure favours a very long-term bearish bias as long as resistance at 1.1714 (24/08/2015 high) holds. The pair is trading in range since the start of 2015. Strong support is given at 1.0458 (16/03/2015 low). However, the current technical structure since last December implies a gradual increase.
GBP/USD
Riding symmetrical triangle.
-
GBP/USD is well located within a symmetrical triangle. Hourly support is given around 1.2185 (lower bound of the symmetrical triangle) while hourly resistance lies at 1.2332 (19/10/2016 high). Key resistance stands far away at 1.2620 then 1.2873 (03/10/2016). Expected to show further bearish breakout.
-
The long-term technical pattern is even more negative since the Brexit vote has paved the way for further decline. Long-term support given at 1.0520 (01/03/85) represents a decent target. Long-term resistance is given at 1.5018 (24/06/2015) and would indicate a long-term reversal in the negative trend. Yet, it is very unlikely at the moment.

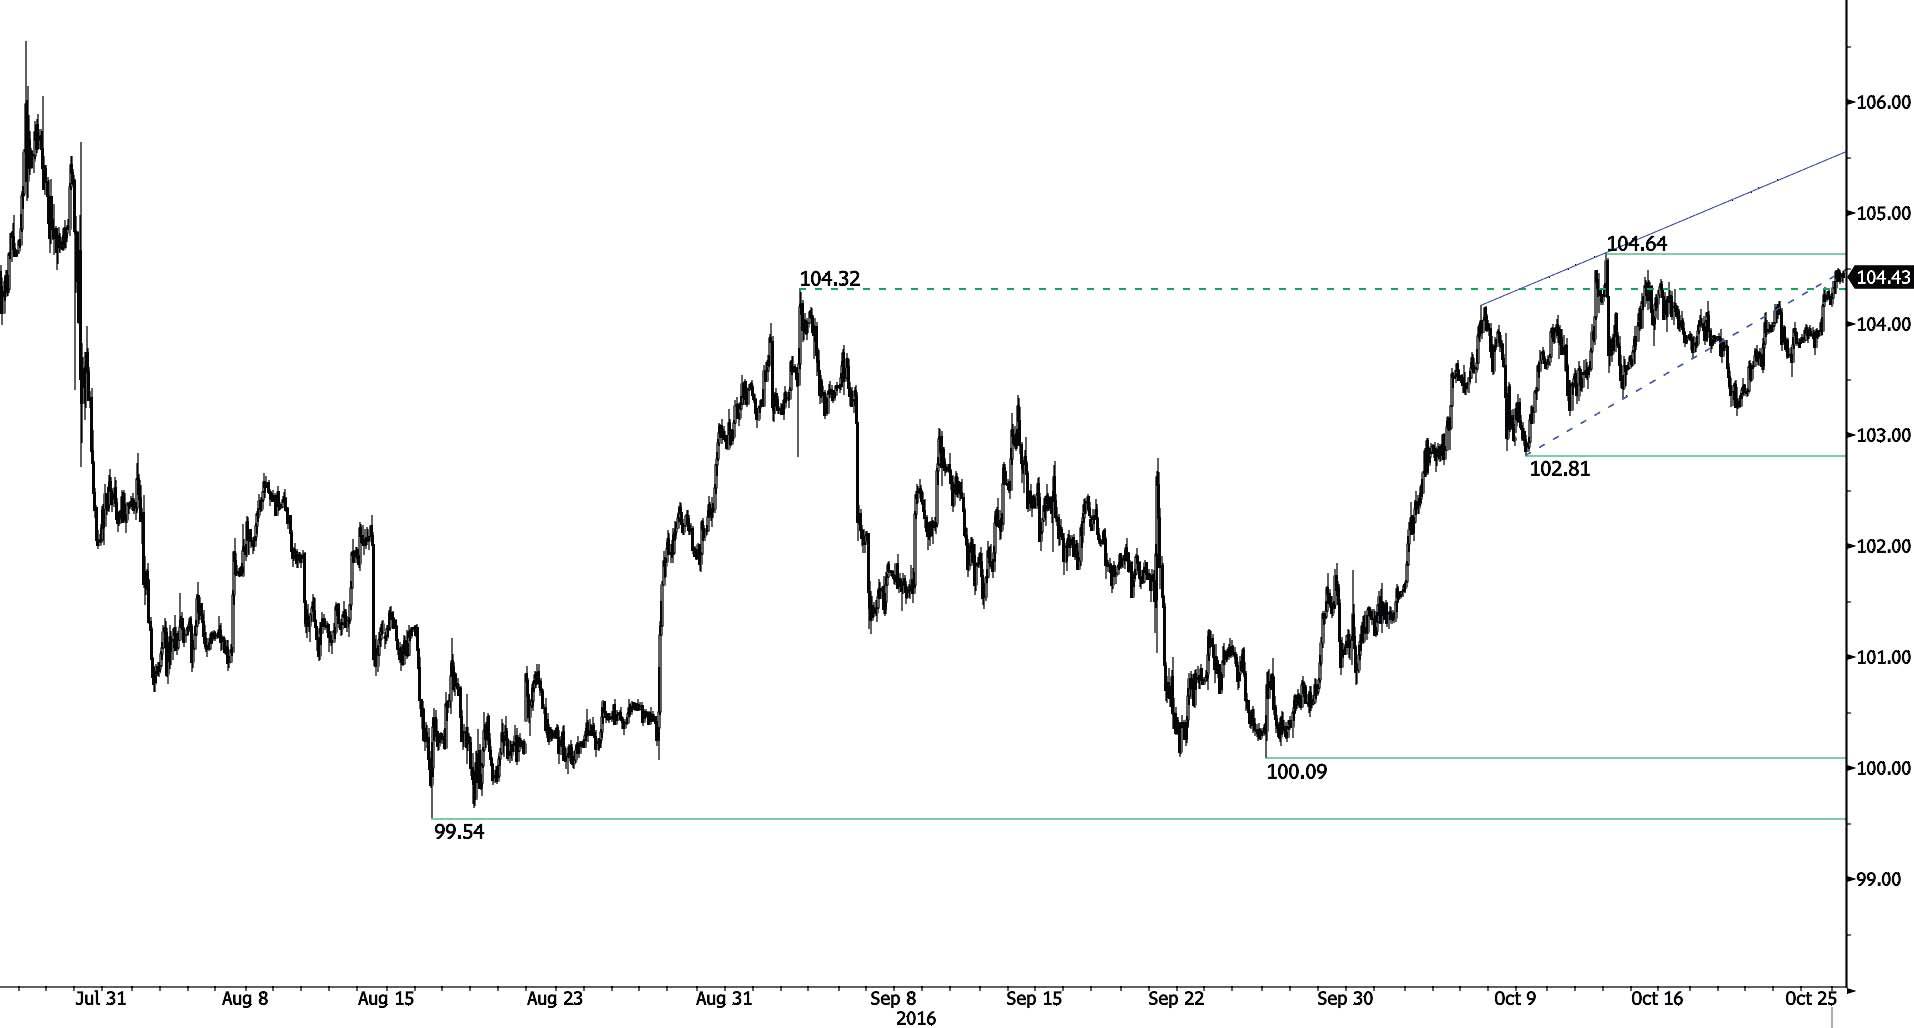
USD/JPY
Monitoring resistance area between 104.50 and 105.00
-
USD/JPY is going higher. A break of hourly support at 102.81 (10/10/2016 low) is unlikely at the moment. Key support can be found at 100.09 (27/09/2016). Hourly resistance can be found at 104.64 (13/10/2016 higher). Expected to see renewed selling pressures around 104.15-30.
-
We favor a long-term bearish bias. Support is now given at 96.57 (10/08/2013 low). A gradual rise towards the major resistance at 135.15 (01/02/2002 high) seems absolutely unlikely. Expected to decline further support at 93.79 (13/06/2013 low).
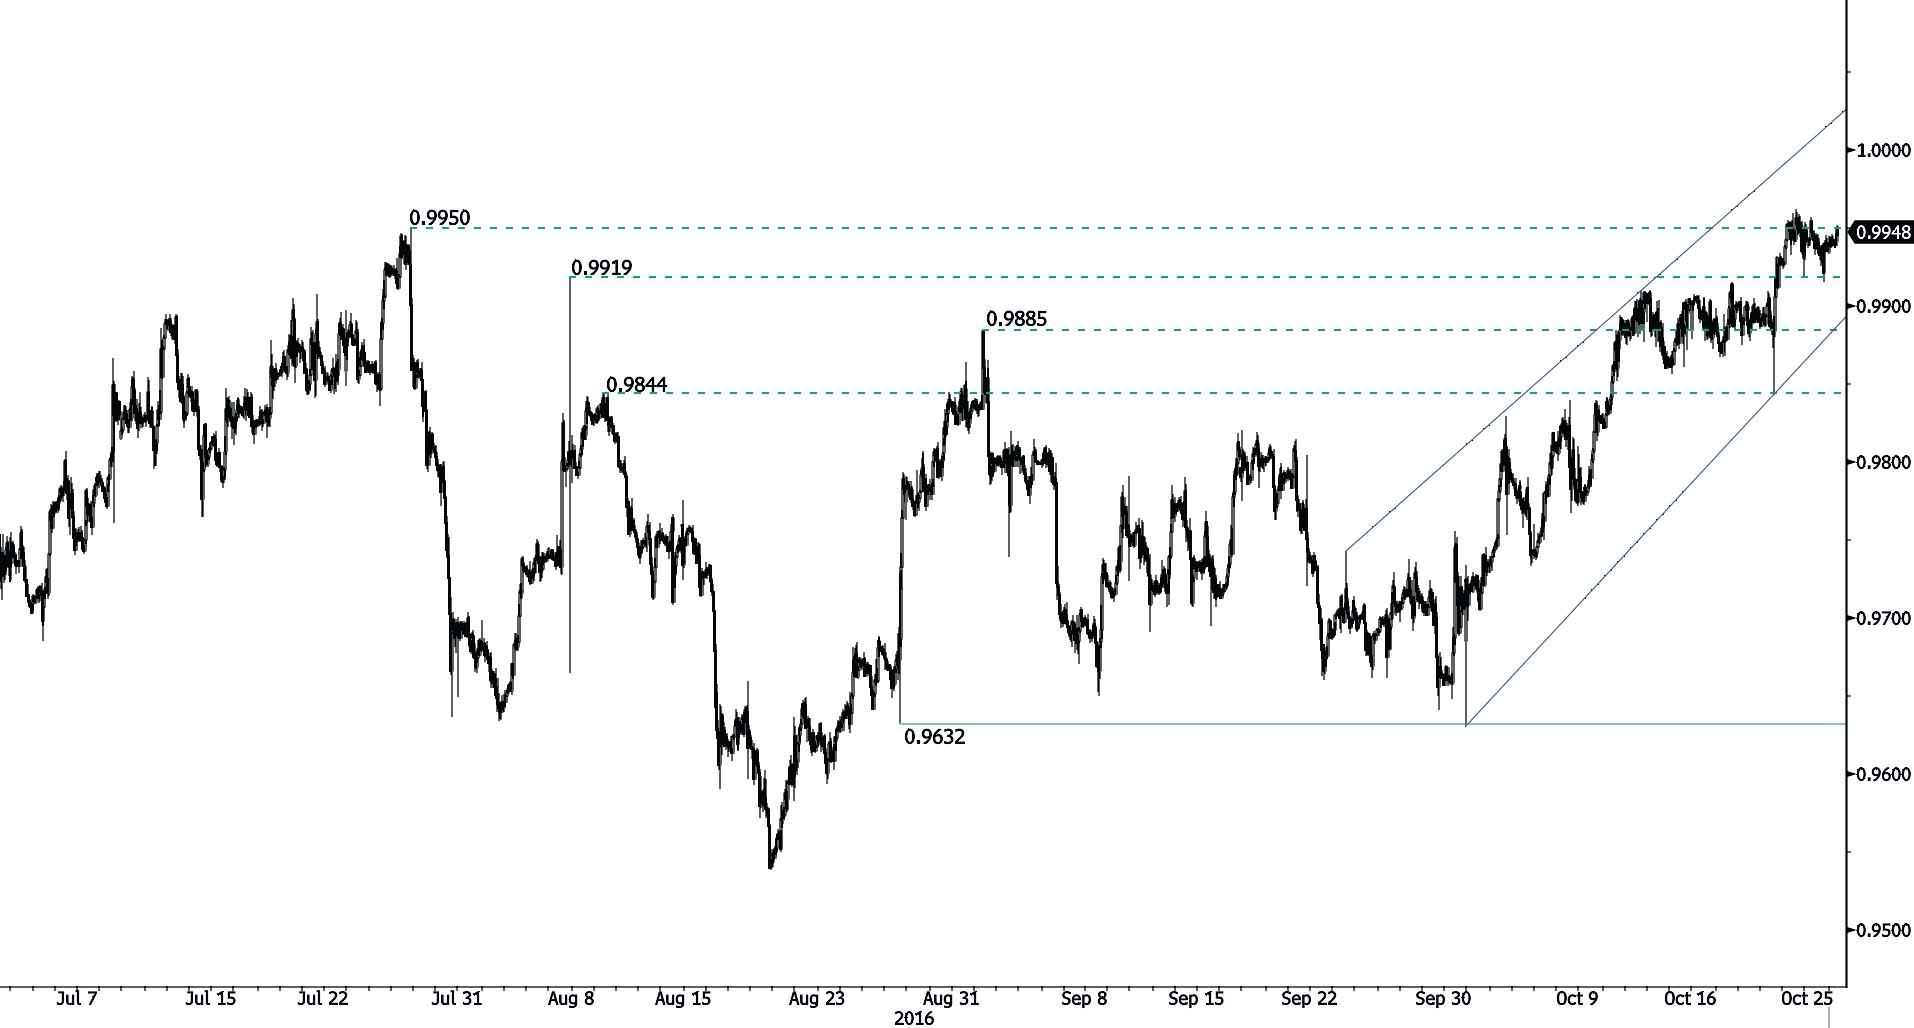
USD/CHF
Moving sideways.
-
USD/CHF is still lying within former resistance area between 0.9919 (07/08/2016 low) and 0.9950 (27/07/2016). The pair remains nonetheless on a bullish momentum since September 15. Hourly support is located at 0.9733 (05/10/2016 base) then 0.9632 (26/08/2016 base low). Expected to see continued increase.
-
In the long-term, the pair is still trading in range since 2011 despite some turmoil when the SNB unpegged the CHF. Key support can be found 0.8986 (30/01/2015 low). The technical structure favours nonetheless a long term bullish bias since the unpeg in January 2015.
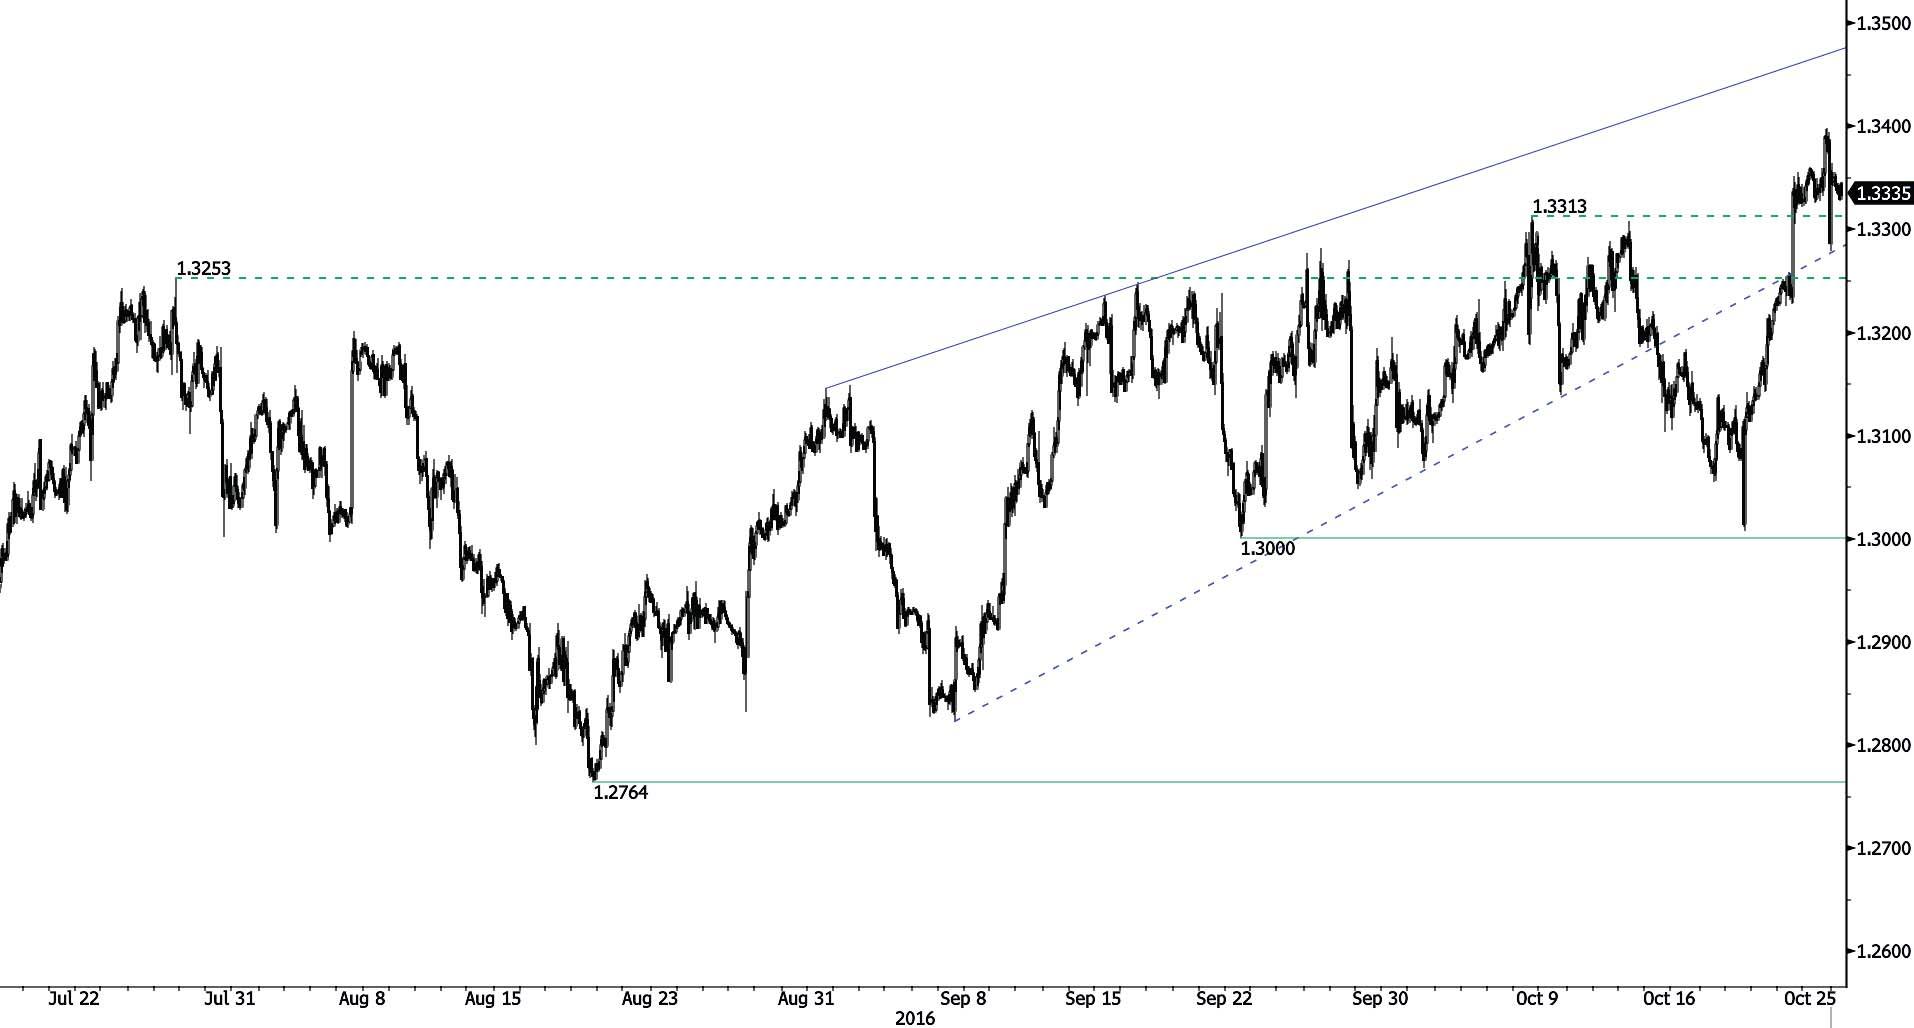
USD/CAD
Stronger volatility.
-
USD/CAD is trading within strong resistance area between 1.3253 and 1.3405. The buying pressures are fading around those levels. Expected to bounce back toward key support which can be found at 1.3000 (22/09/2016 low).
-
In the longer term, the pair is trading around its 200-day moving average. Strong resistance is given at 1.4690 (22/01/2016 high). Long-term support can be found at 1.2461 (16/03/2015 low). The pair is likely in a consolidation phase within a new long-term increase.
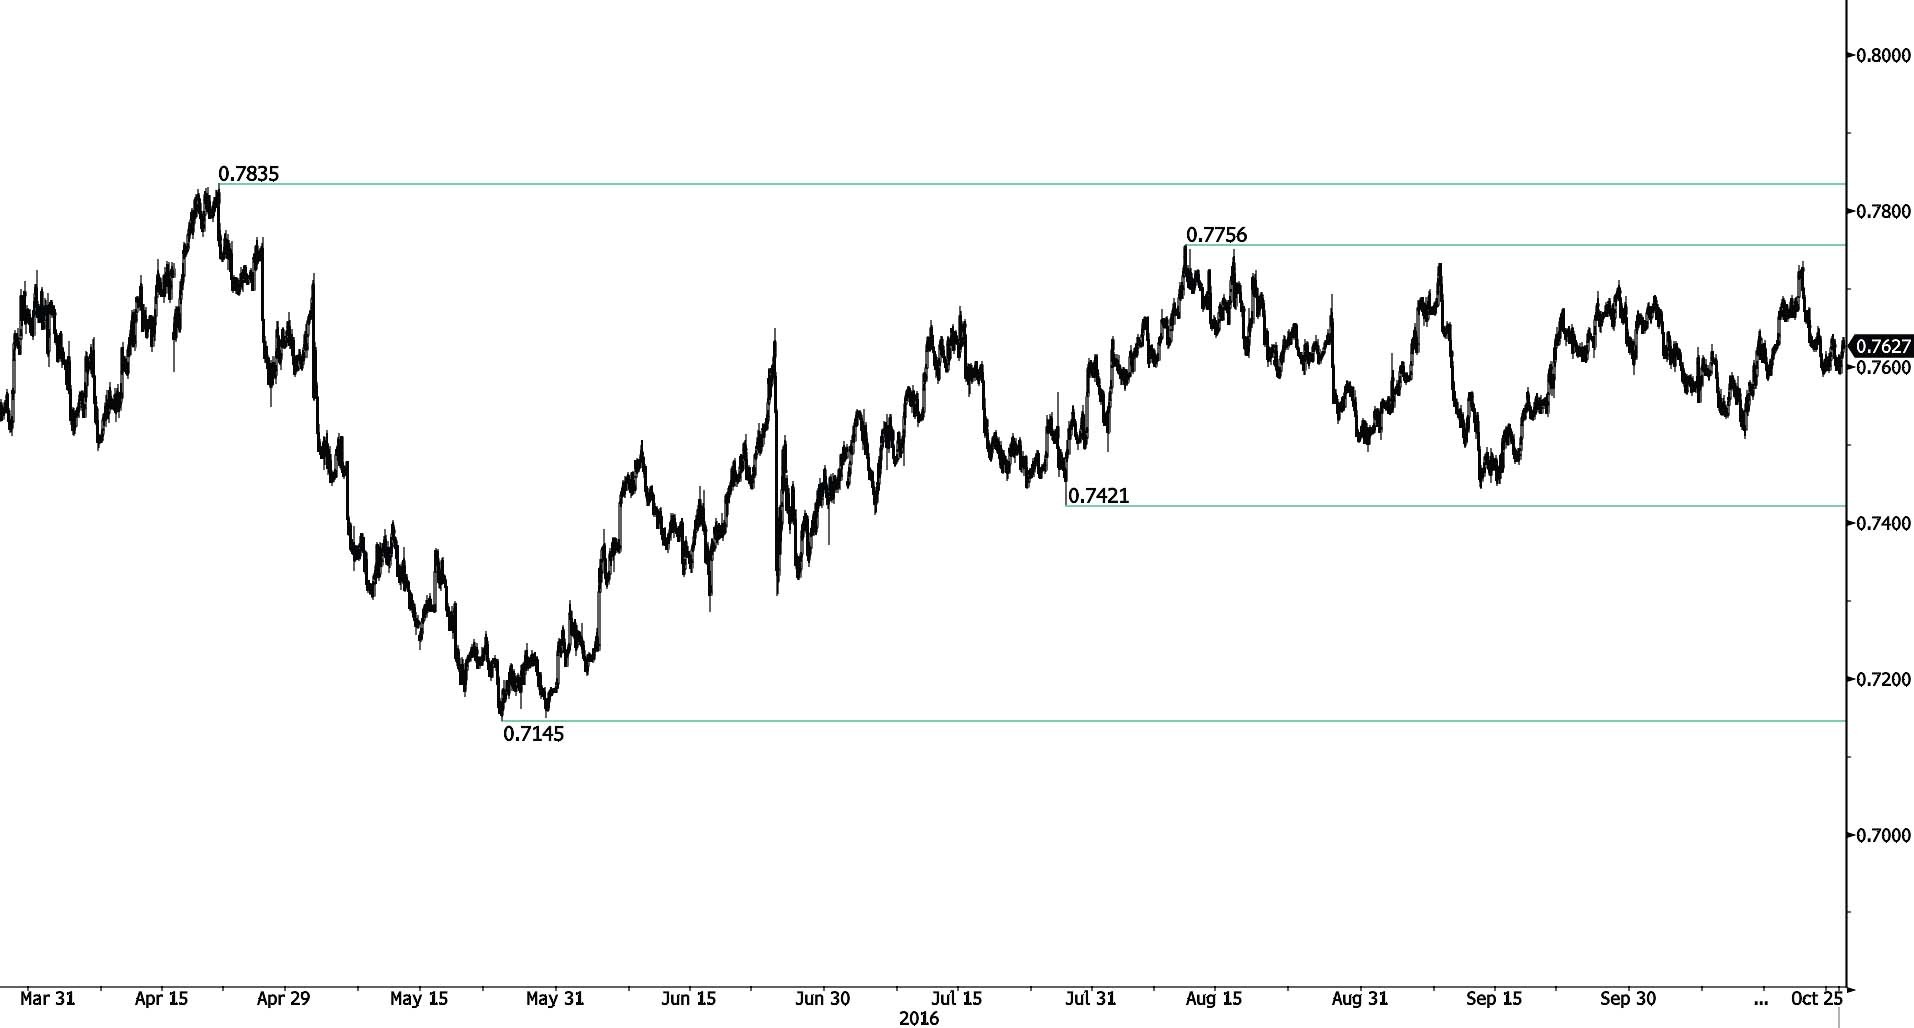
AUD/USD
Trading in range.
-
AUD/USD keeps on trading for the past three months between hourly resistance located at 0.7756 (10/08/2016 high) and hourly support given at 0.7507 (13/10/2016 low). Expected to continue bouncing back lower.
-
In the long-term, we are waiting for further signs that the current downtrend is ending. Key supports stand at 0.6009 (31/10/2008 low) . A break of the key resistance at 0.8295 (15/01/2015 high) is needed to invalidate our long-term bearish view.
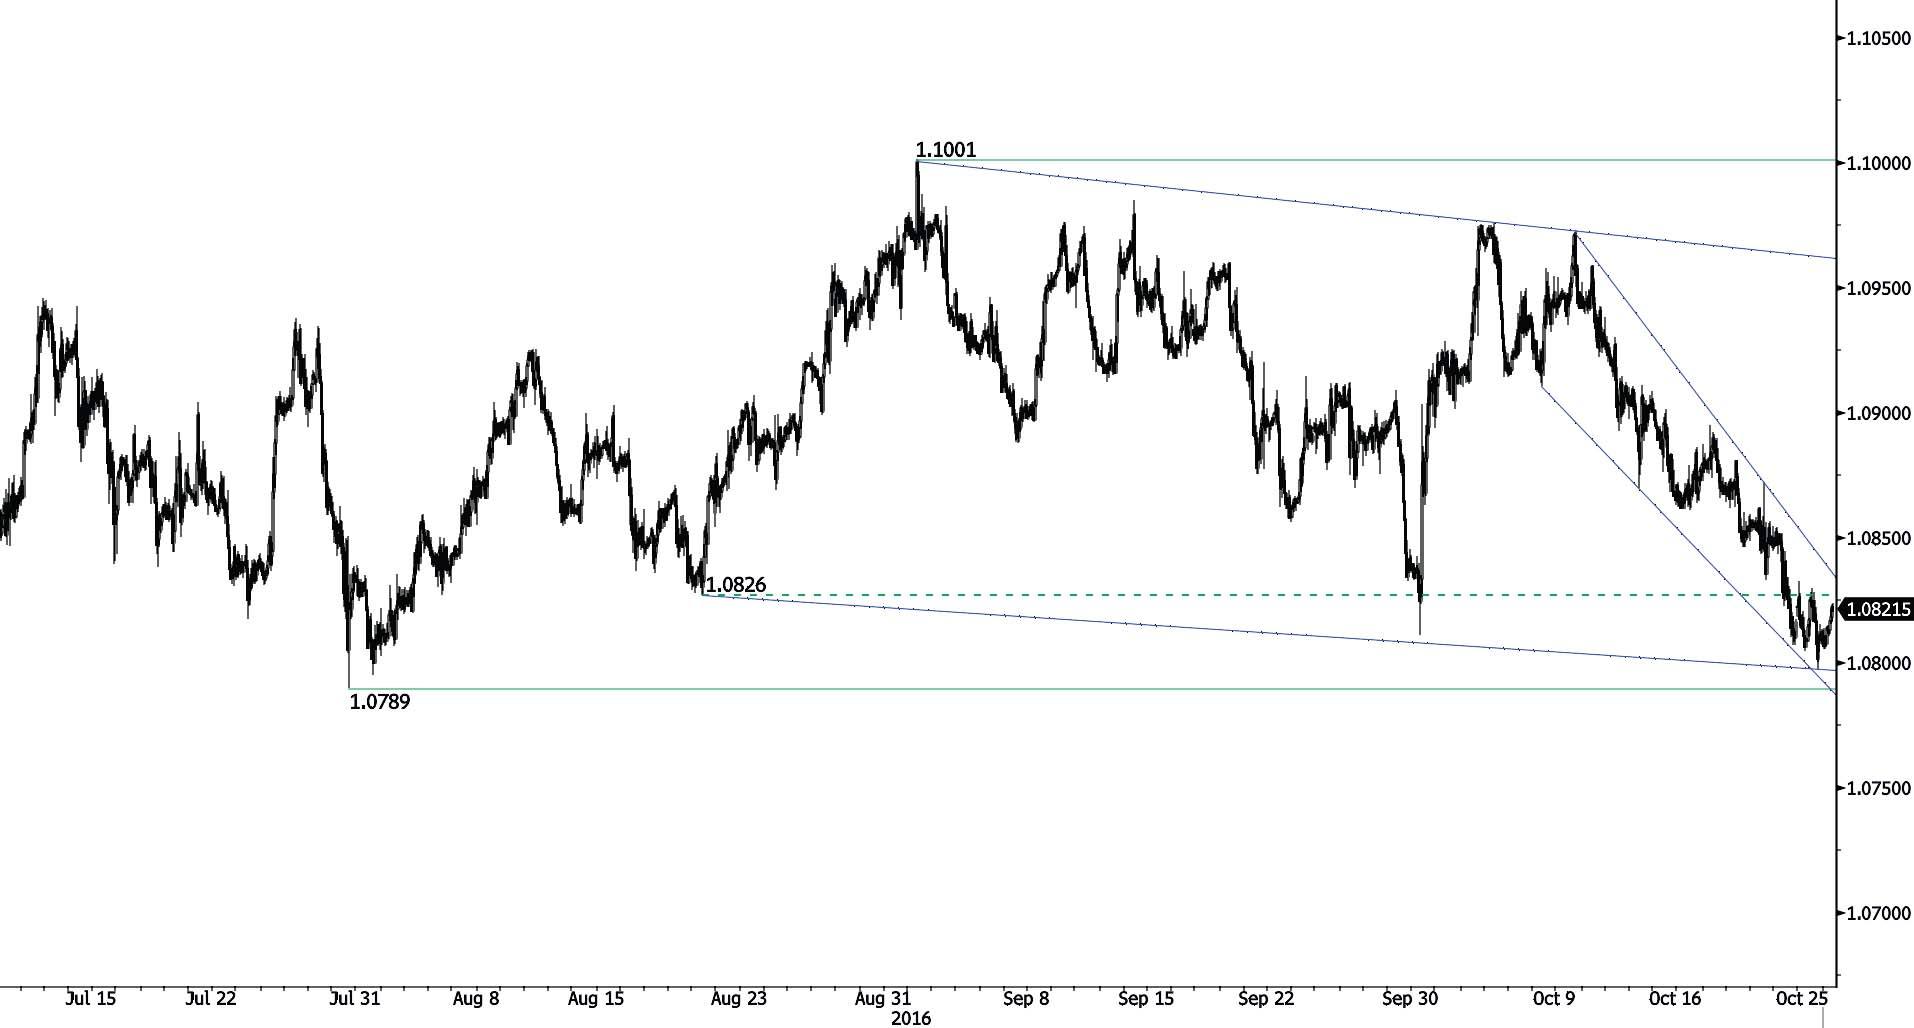
EUR/CHF
Selling pressures are fading around 1.0800.
-
EUR/CHF is trading above 1.0800. The pair is now having difficulties to go any lower. On the other side, strong resistance at 1.1037 looks difficult to reach. Expected to further weaken.
-
In the longer term, the technical structure remains positive. Resistance can be found at 1.1200 (04/02/2015 high). Yet,the ECB's QE programme is likely to cause persistent selling pressures on the euro, which should weigh on EUR/CHF. Supports can be found at 1.0184 (28/01/2015 low) and 1.0082 (27/01/2015 low).
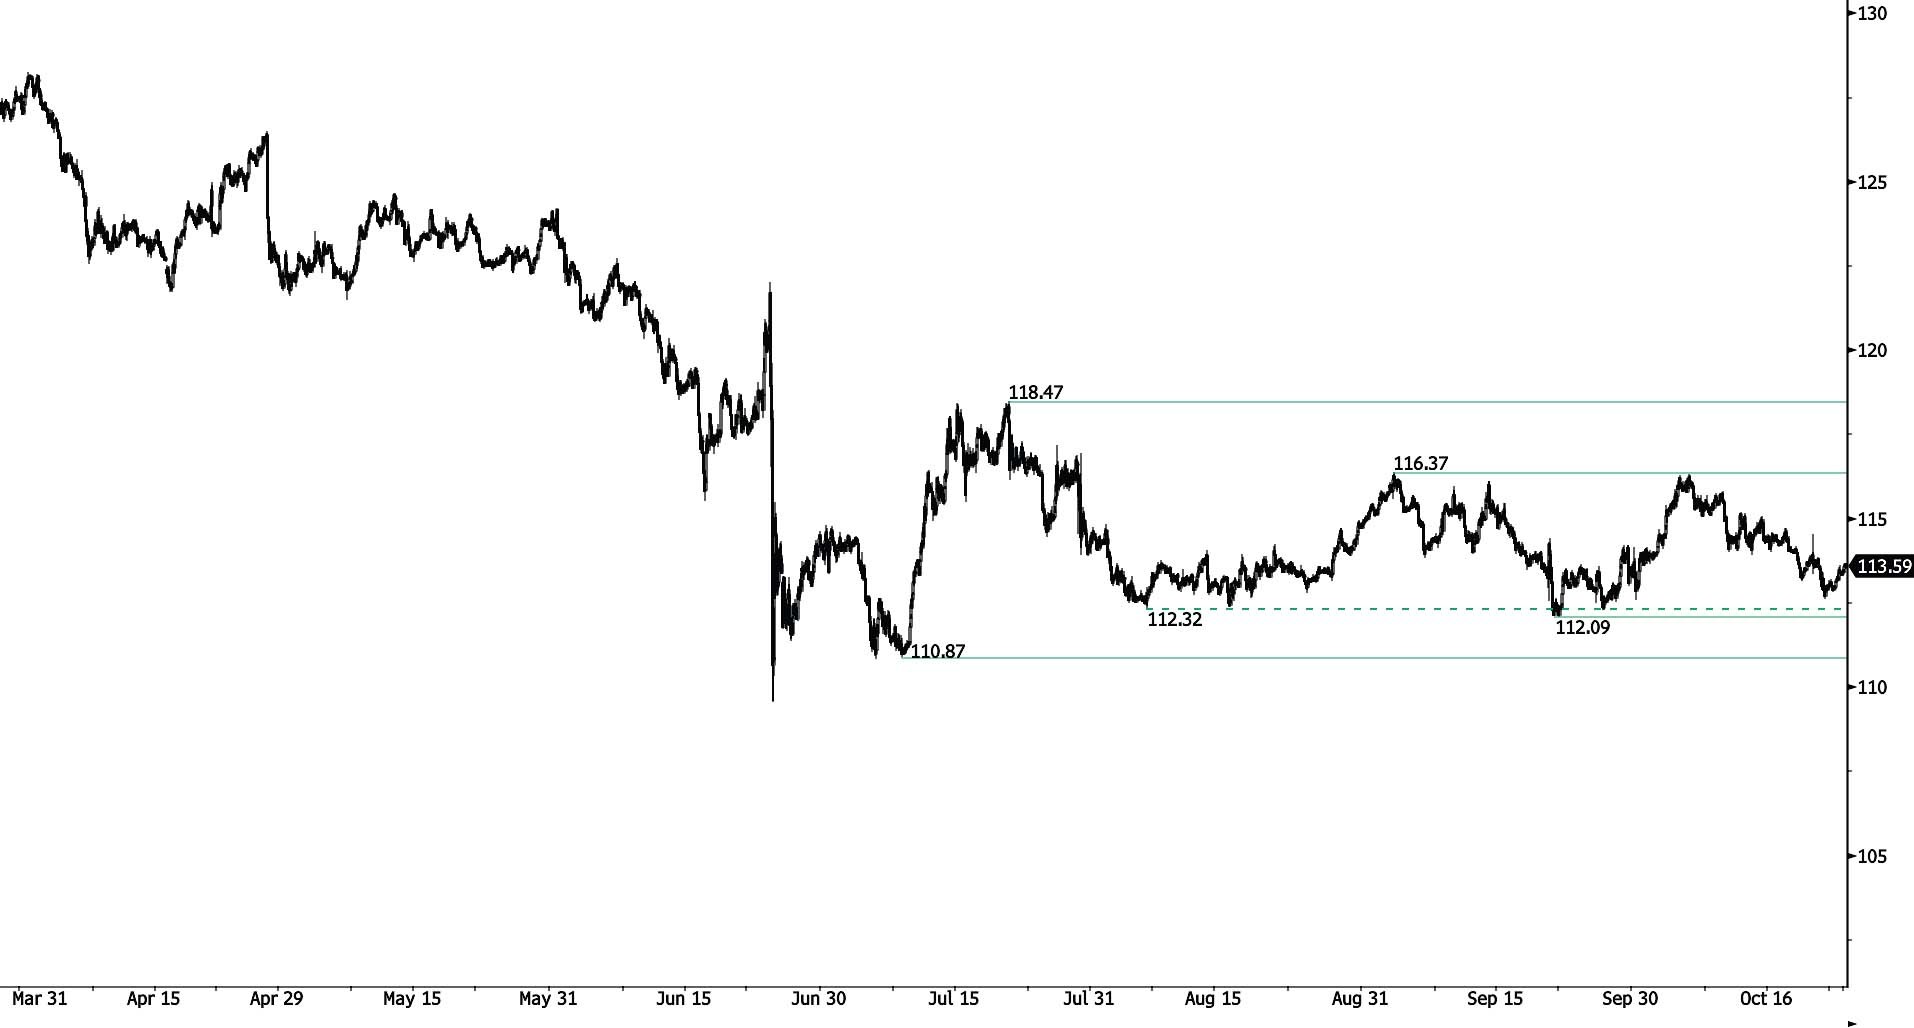
EUR/JPY
Bouncing.
-
EUR/JPY is trading mixed between resistance located at 116.37 (02/09/2016) and support at 112.09 (21/09/2016 low). Stronger support lies at 1110.83 (06/07/2016 low). Expected to target 112 before bouncing back.
-
In the longer term, the technical structure validates a medium-term succession of lower highs and lower lows. As a result, the resistance at 149.78 (08/12/2014 high) has likely marked the end of the rise that started in July 2012. The road is now wide open towards strong support at 94.12 (24/07/2012 low).
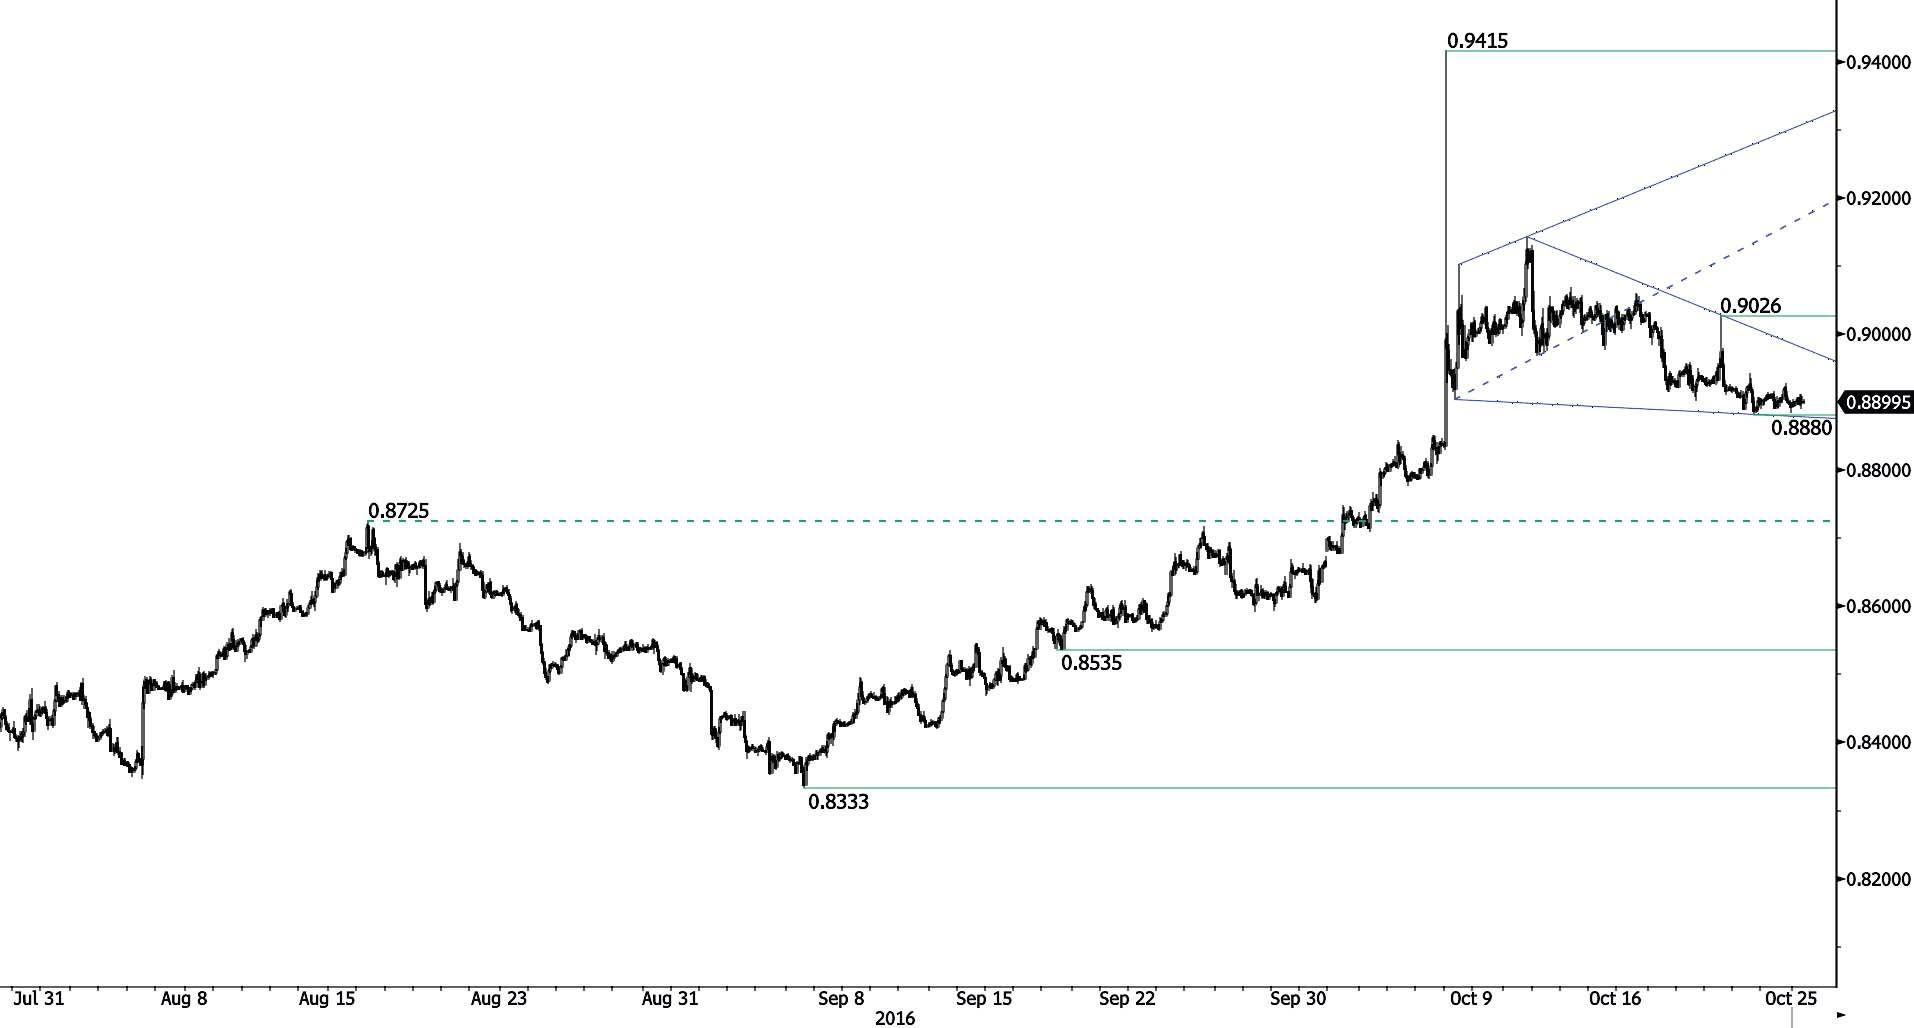
EUR/GBP
Volatility lowers.
-
EUR/GBP's bearish momentum seems to fade since the pair has broken uptrend channel. Hourly support is given at 0.8776 (05/10/2016 low) while resistance is given at 0.9026 (20/10/2016 high). Expect to show renewed bearish pressures.
-
In the long-term, the pair is currently recovering from recent lows in 2015. The technical structure suggests a growing upside momentum. The pair is trading far above from its 200 DMA. Strong resistance can be found at 0.9500 psychological level.
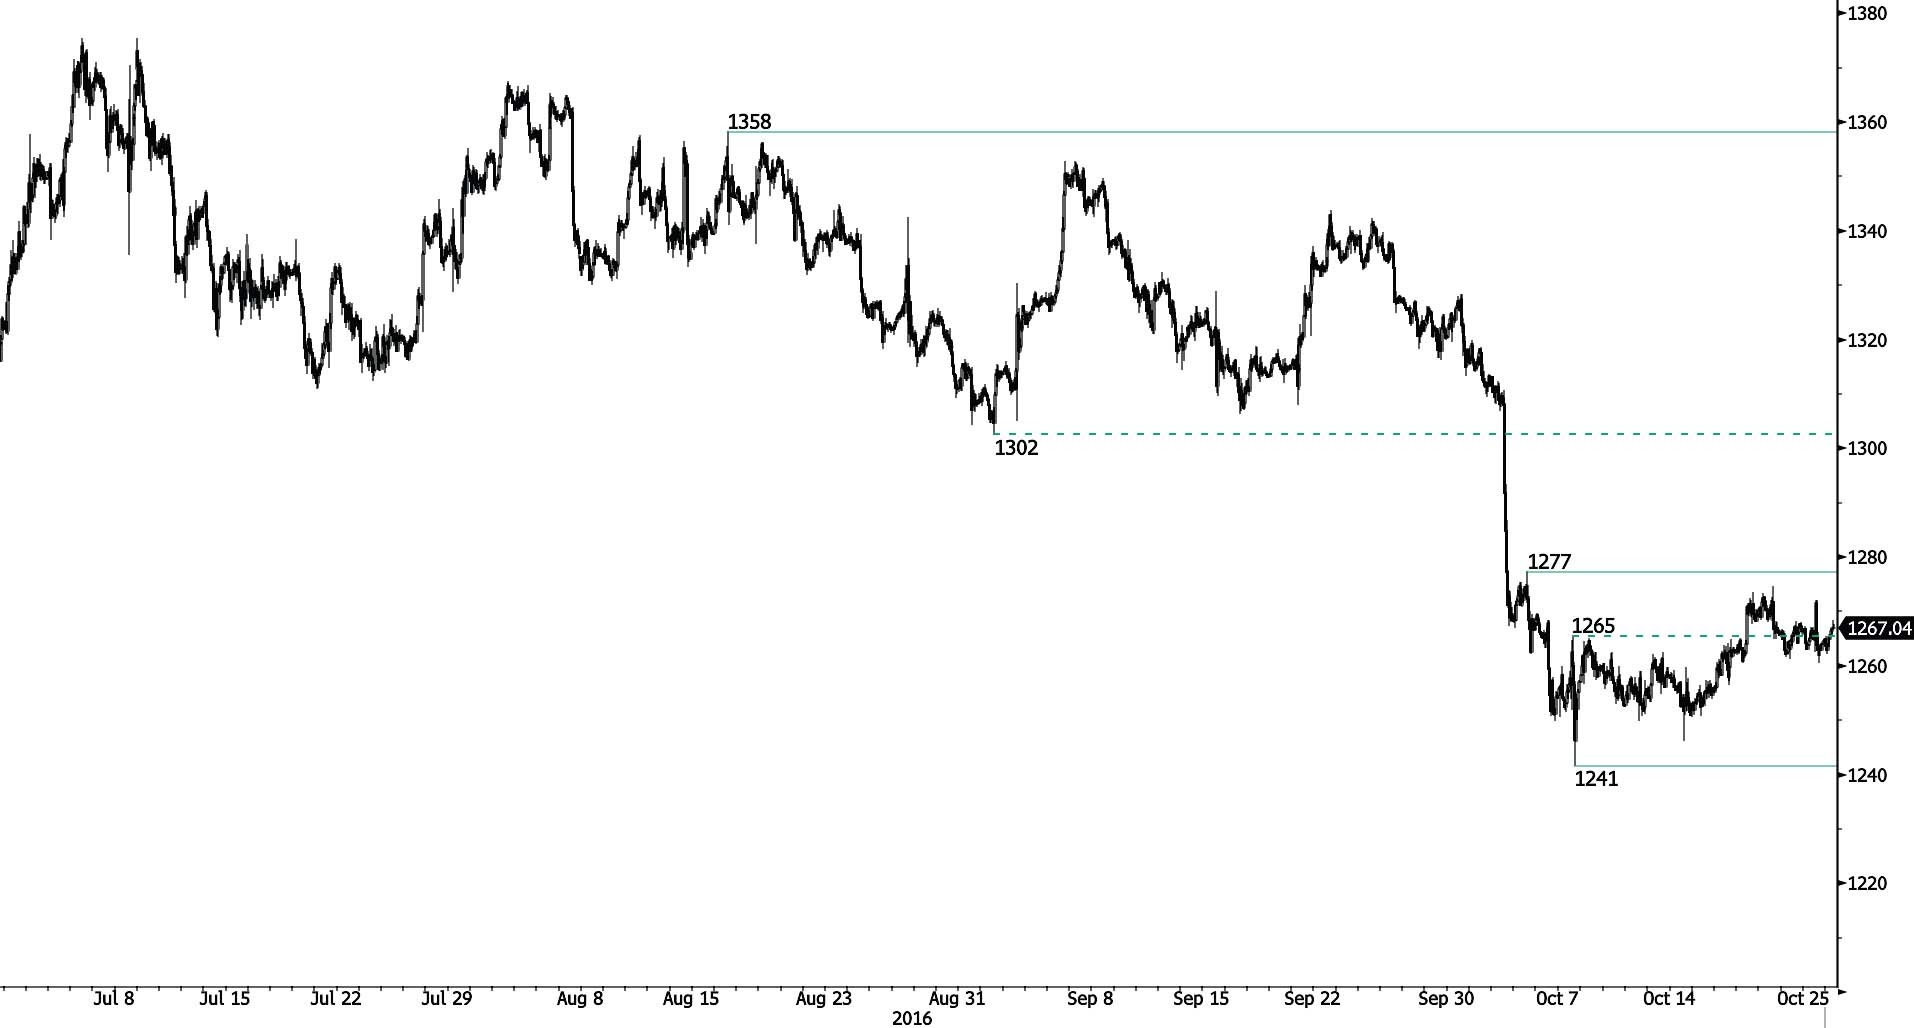
GOLD (in USD)
Direction-less.
-
Gold is moving up and down. Hourly support is located at 1261 (21/10/2016 high). Stronger support is given at 1241 (07/10/2016 low ). Hourly resistance lies at 1277 (05/10/2016 high).
-
In the long-term, the technical structure suggests that there is a growing upside momentum. A break of 1392 (17/03/2014) is necessary ton confirm it, A major support can be found at 1045 (05/02/2010 low).
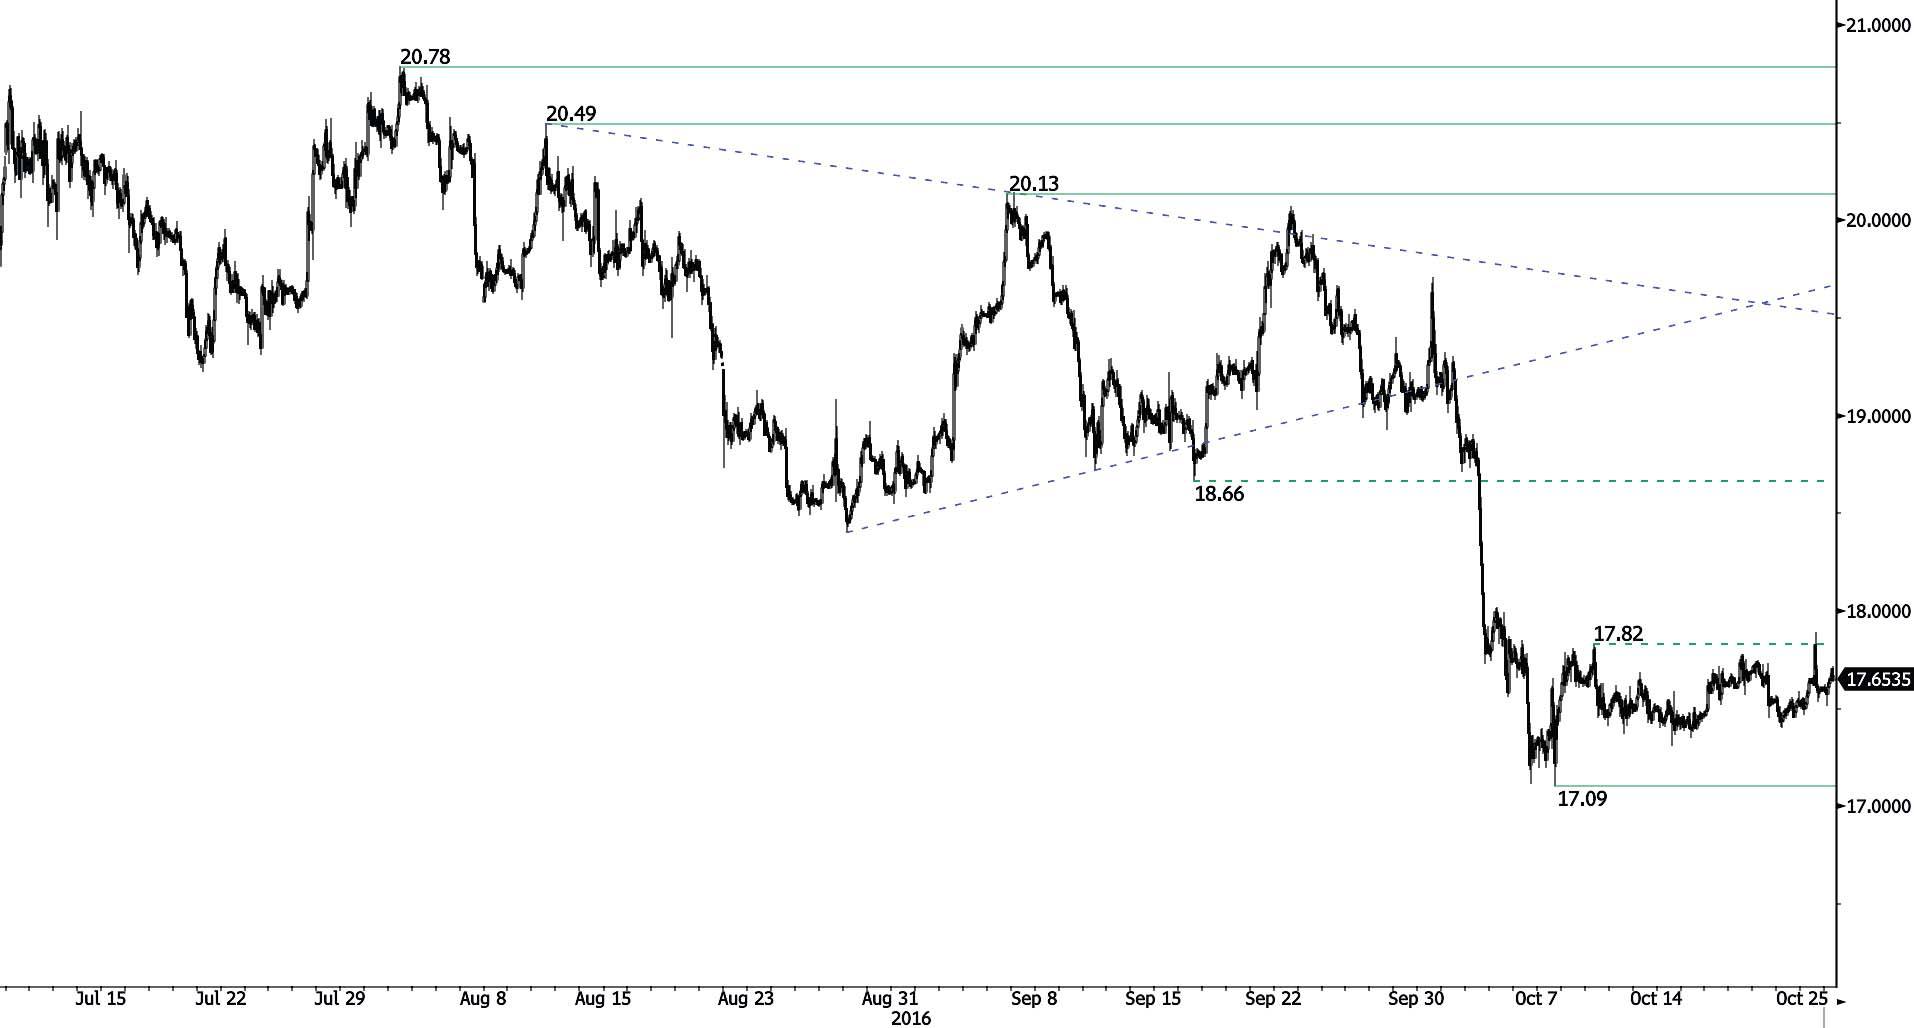
SILVER (in USD)
False breakout.
-
Silver is still trading mixed despite the metal has broken hourly resistance given at 17.82 (11/10/2016 high). Hourly support can be found at 17.09 (07/10/2016 low). Key resistance is given at 18.88 (04/10/2016 base). Expected to see a new leg higher.
-
In the long-term, the metal is now in an increasing uptrend. Resistance is located at 25.11 (28/08/2013 high). Strong support can be found at 11.75 (20/04/2009).
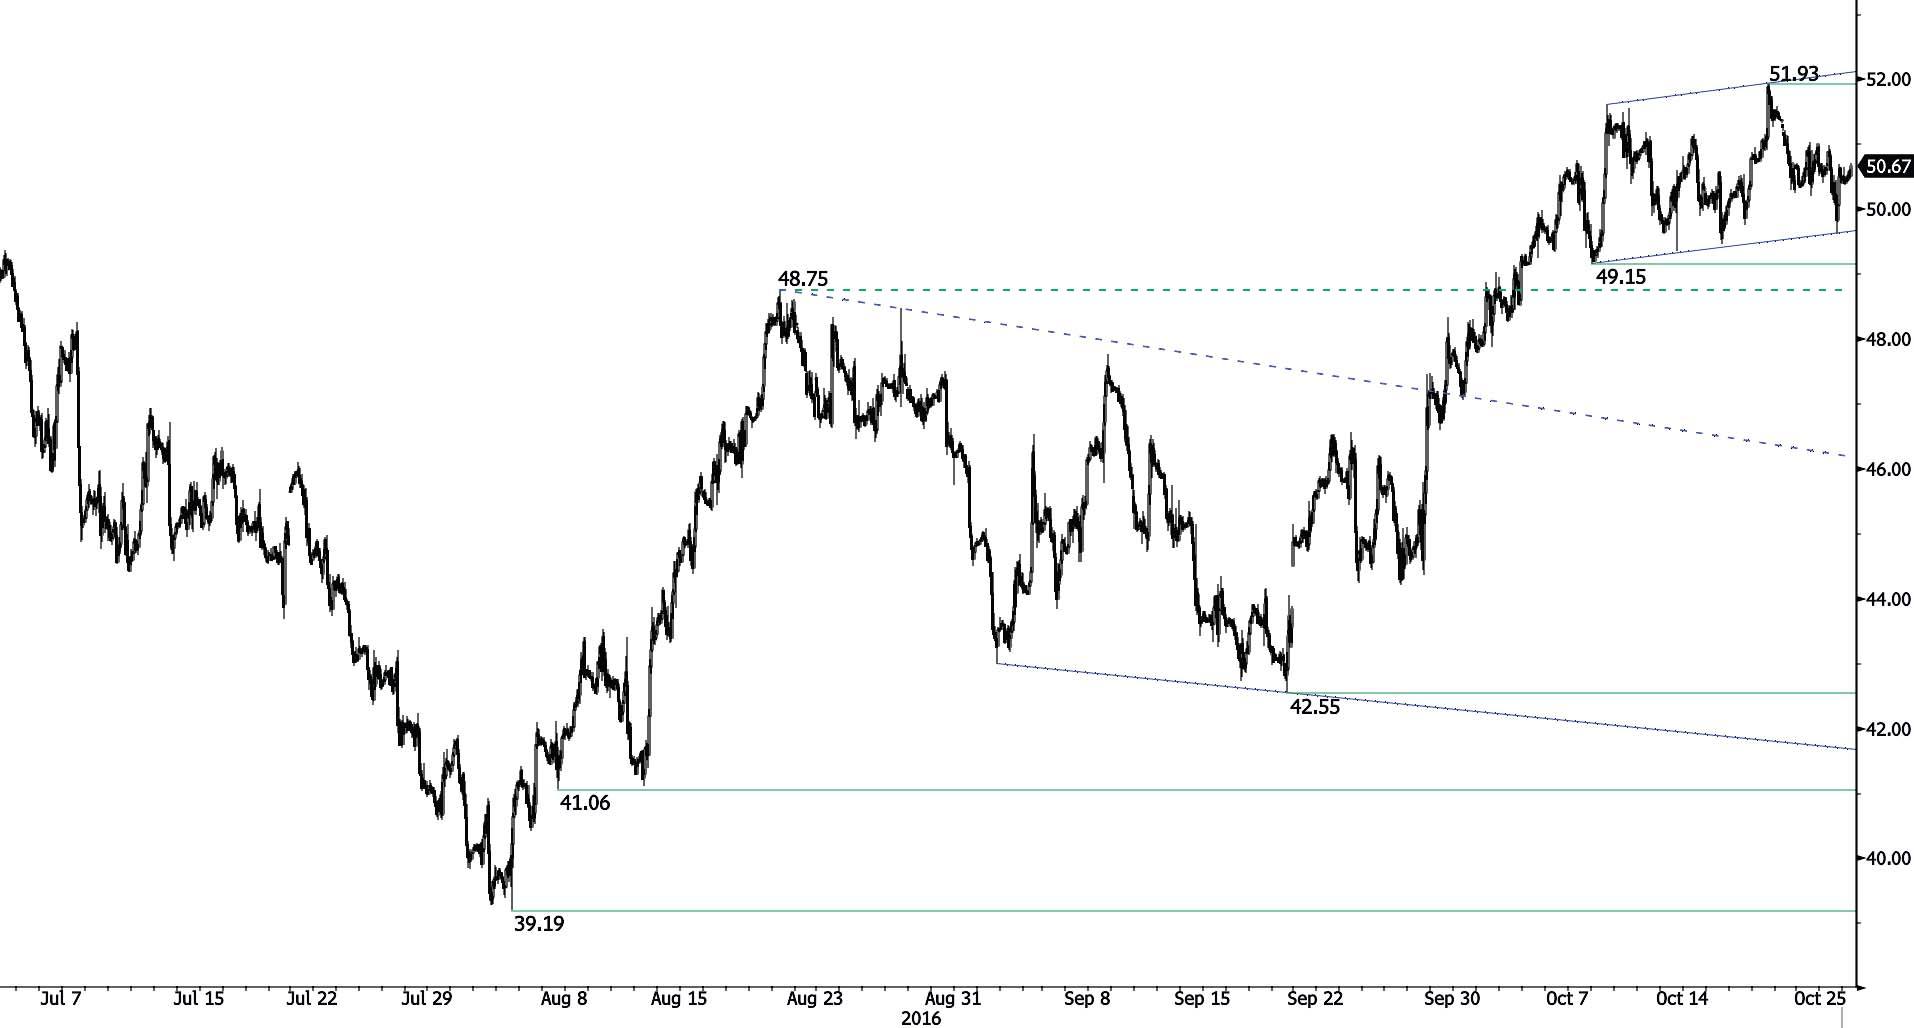
Crude Oil (in USD)
Buying pressures are still lively.
-
Crude oil is trading within short-term uptrend channel. Support can be found at 49.15 (10/10/2016 low) then 46.50/68 (22/09/2016 high). Buying pressures, despite being still lively, are diminishing and we maintain our bearish view. Positions should be loaded up at this level.
-
In the long-term, crude oil is now recovering from its sharp decline and the signs of recovery are now strong. Strong support lies at 24.82 (13/11/2002) while strong resistance at 50.96 (09/10/2015 high) has been broken. Crude oil is holding way above its 200-Day Moving Average. Expected to reach 60 before year-end.
Author

Yann Quelenn
Swissquote Bank Ltd
Yann Quelenn is a Market Analyst at Swissquote Bank with strong technical and financial background. Previously, he worked as FX Trader at Banque Privée Edmond de Rothschild and as Portfolio Manager at Polaris Investment in Luxembourg.


