Sentiment holding up as monetary easing measures continue to come

Market Overview
An improvement in market sentiment may have just had the reins pulled slightly, but the prospect of further monetary easing is still supportive. Friday’s rather mixed Non-farm Payrolls report left markets a little flat, but will have done little to change any views on the FOMC. Headline jobs disappointed (in an admittedly tight labor market) but with wages holding up relatively well, there were still signs that the US consumer will remain reasonably robust. However, the legacy of the trade dispute is still prevalent and was laid out as the Chinese trade data over the weekend which showed a surprise decline in export levels (of -1.0% versus an expected growth of +2.1%). This is another indication of the negative impact of the ongoing dispute. The monetary policy of major central banks should continue down respective paths of easing. The move by China to cut the reserve requirement ratio by 50bps on Friday is unlikely to be its last. Fed chair Powell talked on Friday about acting “as appropriate” to maintain economic expansion, whilst the ECB likely to follow suit with a package of easing measures on Thursday. Treasury yields have stuttered since Friday’s payrolls, but the VIX volatility index is at five week lows and sets up equities well into the new week. Risk appetite has been showing signs of improvement recently and it will be interesting to see whether this continues in the coming days. The early Monday signs are of cautious optimism in trading sentiment, leading to little real direction across major forex.

Wall Street closed mildly higher on Friday (S&P 500 +0.1% at 2979) with US futures +0.2% this morning. This has helped decent gains on Asian markets with Nikkei +0.6% and the Shanghai Composite also +0.6%. In Europe there is a cautiously positive look to opening moves, with the FTSE futures +0.5% and outperforming slightly (sterling weakness eyed) whilst DAX futures are +0.2%. In forex majors, there is little real USD direction, although GBP is slipping back ahead of another important day for Brexit, whilst AUD is performing well again. In commodities, there is a degree of stabilisation on gold, whilst oil continues to push higher for a fourth straight session.
There is a focus on UK data on a quiet day for the economic calendar. UK monthly GDP for July is at 0930BST and is expected to show monthly growth of +0.1% which would help the rolling 3 monthly GDP to -0.1%. UK Industrial Production at 0930BST is expected to show production falling by -0.1% in July which would drag the year on year decline back to -1.1% (from -0.6% in June). The UK Trade Balance is also at 0930BST and is expected to see the deficit deteriorate to-£9.6bn in July (from a deficit of -£7.0bn in June).
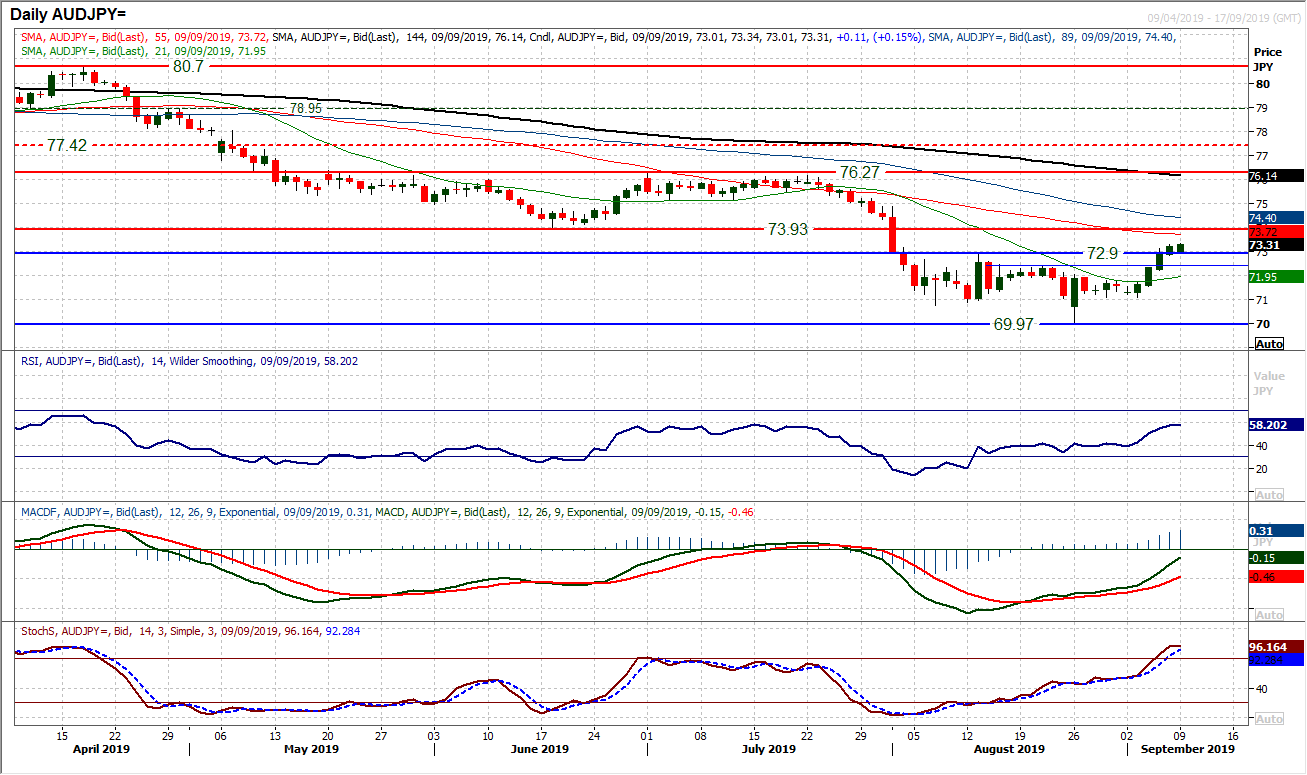
Chart of the Day – AUD/JPY
The risk rally of the past week is playing strongly through Aussie/Yen. A breakout above 72.90 has been the first decisive breach of a key lower high since the big sell-off kicked in back in April. This now suggests that the bulls are on the recovery trail. A base pattern completed above 72.90 implies around 210 pips of recovery towards 74.00 area. This would suggest that the move should continue to pull higher to test the 73.93 old key June low. Momentum indicators are reflecting the improvement, with the RSI strengthening above 50, MACD lines accelerating higher and Stochastics strongly configured. The bulls will be looking to use intraday weakness with a band of support 72.40/72.90 as a “buy zone” now. There is little resistance until 73.93 and beyond there 75.00.
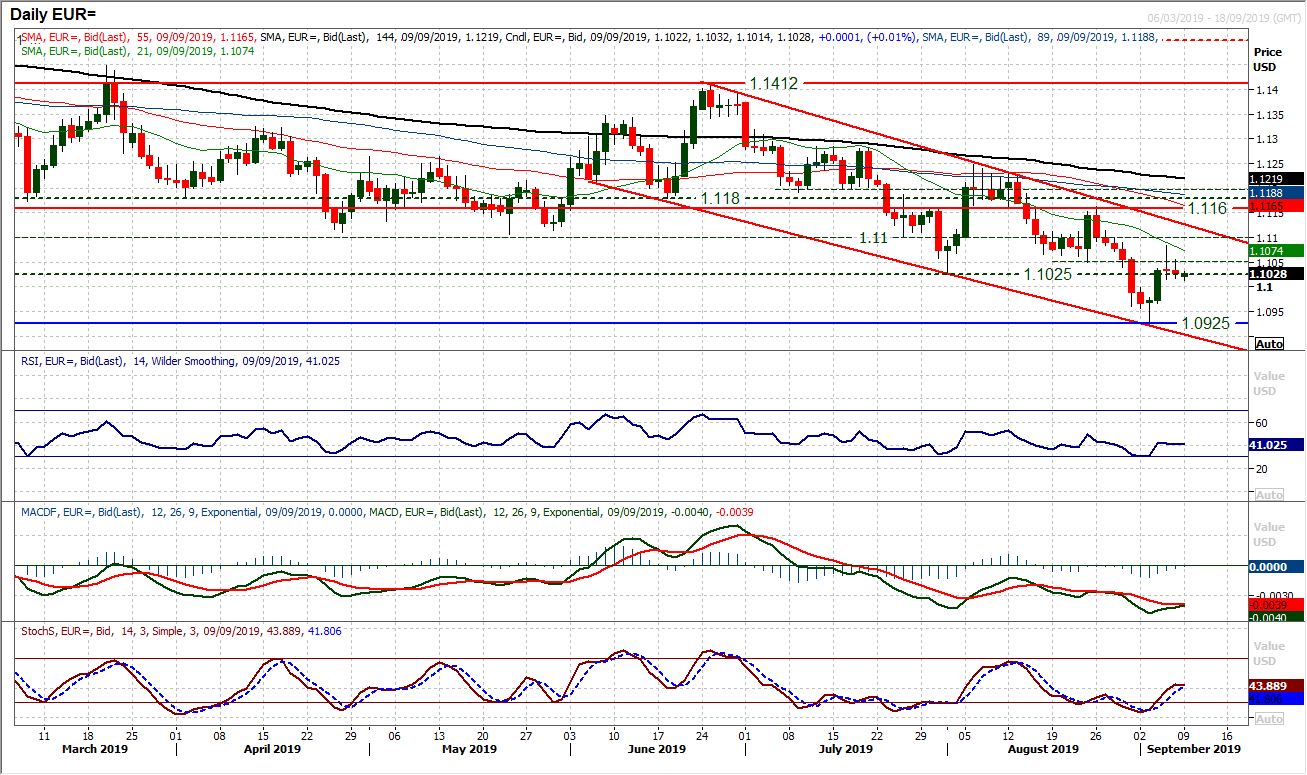
EUR/USD
The near term recovery within the medium term downtrend channel is stuttering. A couple of very uncertain candles in the past two sessions have stopped the bulls in their tracks and threaten to drag the pair lower again. We expect rallies to continue to struggle, within the channel, but also playing out below a clutch of falling moving averages. The momentum indicators maintain their negative medium term configuration to also point towards limited traction in recoveries. There is resistance still around $1.1025, $1.1050 and under the old key low at $1.1100 where all the old stale bulls of the summer months reside. Thursday’s high at $1.1085 is also now notable. There is a degree of initial support around $1.1000 on the hourly chart and a move to close below here would be a negative signal now that would re-open the low at $1.0925.
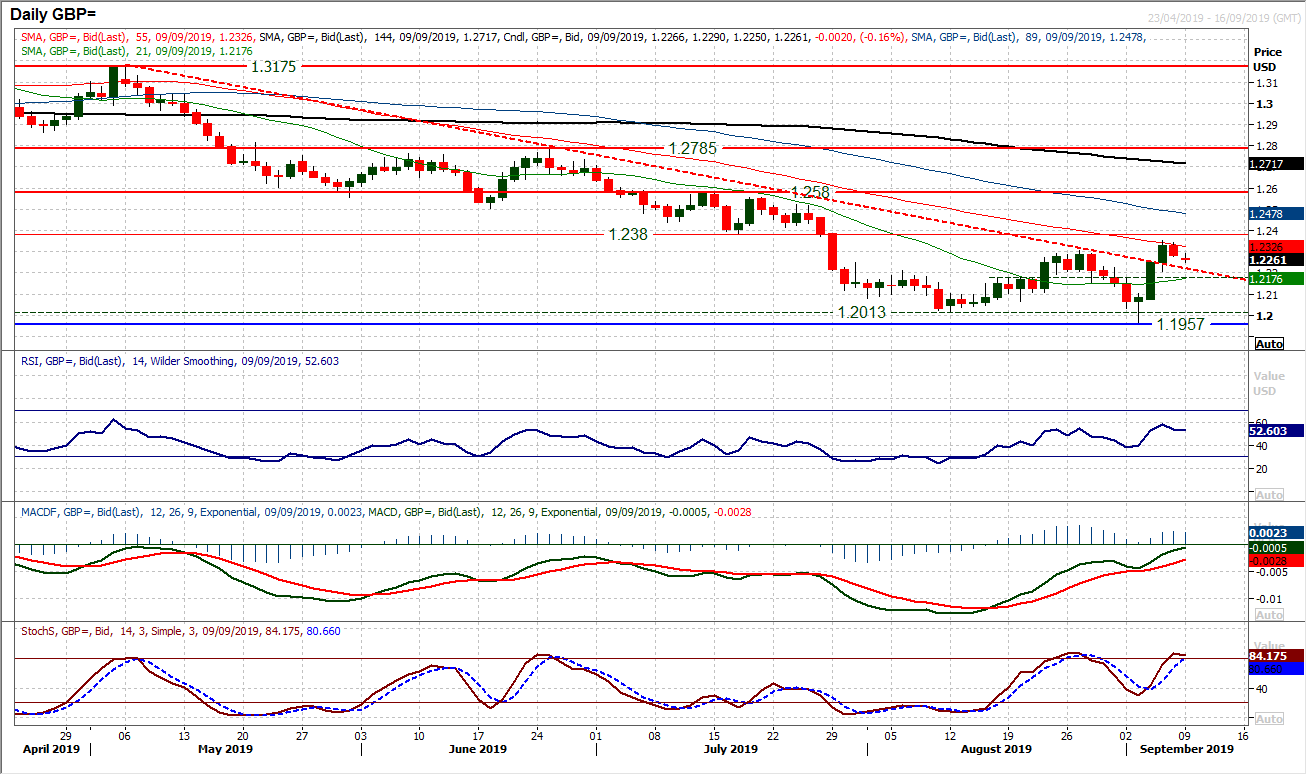
GBP/USD
The sterling rally seems to just have lost its way slightly as Friday’s negative candle cut around 50 pips off Cable and halts the previous strength of the recovery. The reaction of the bulls today could be key (as this is another important day for Brexit in the UK Parliament). The hourly chart shows a formation of a bear drift where lower highs and lower lows are developing. This is dragging momentum indicators back and the support band $1.2160/$1.2210 is coming back into view. This is therefore becoming a test of the new found strength of the sterling bulls. A second solid negative daily candlestick would suggest that the recent bounce was little more than a knee-jerk higher. RSI back under 50 would be a disappointment now. Initial resistance at $1.2300/$1.2310, under the $1.2350 rebound high.
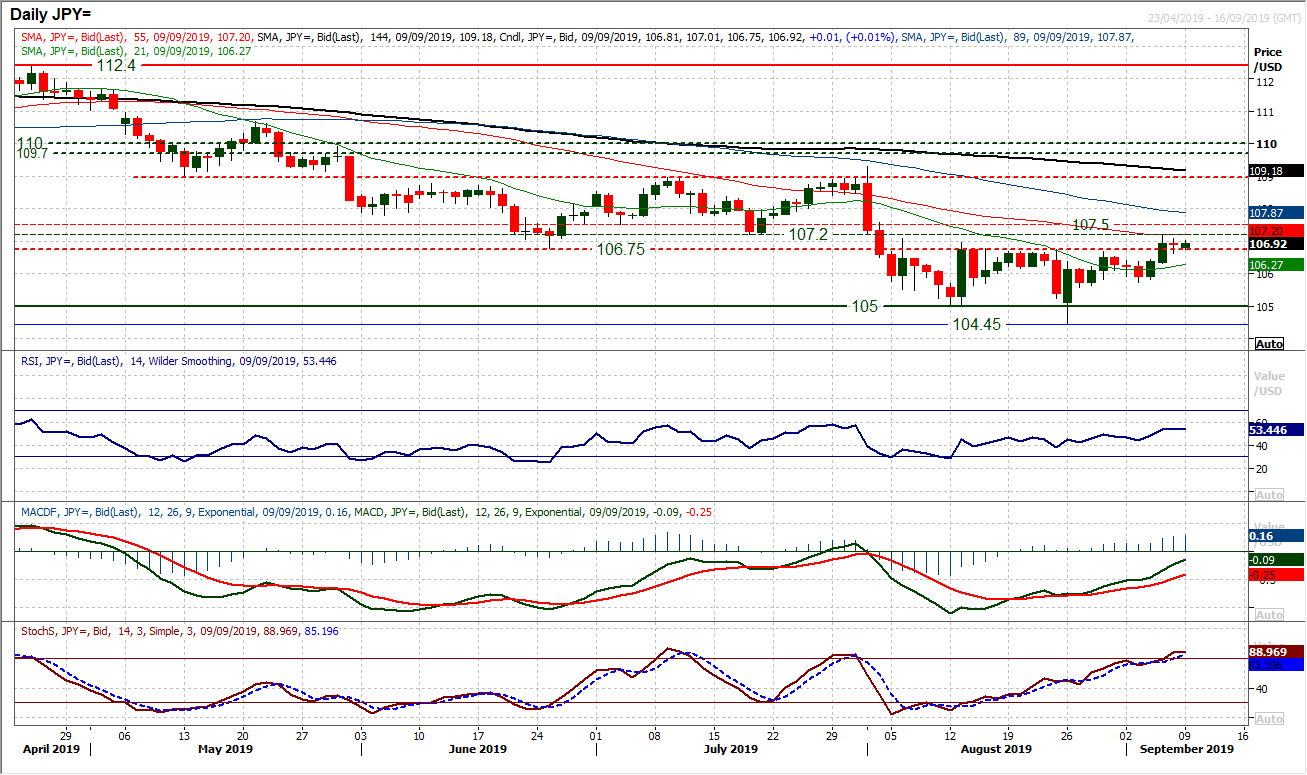
USD/JPY
We continue to look at the overhead supply band between 106.75/107.50 as being restrictive for upside. However, there is still the legacy of last week’s breakout is still present. Can the bulls regather themselves and build upon the breakout? The hourly chart shows a support band 106.40/106.75 will be key to this today. Back on the daily chart there is continued positive momentum trends of the past few days as RSI moves above 50, MACD lines accelerate and Stochastics move into bullish configuration. How the bulls respond in the next couple of days will be key as to whether this is a bear market rally. After stuttering after the payrolls report on Friday, a positive candle today would be a signal of intent from the bulls. Initial resistance at 107.20. To see the market closing back under 106.75 would now be a disappointment and closing below 106.40 would be a sense that the bulls were failing again.
Gold
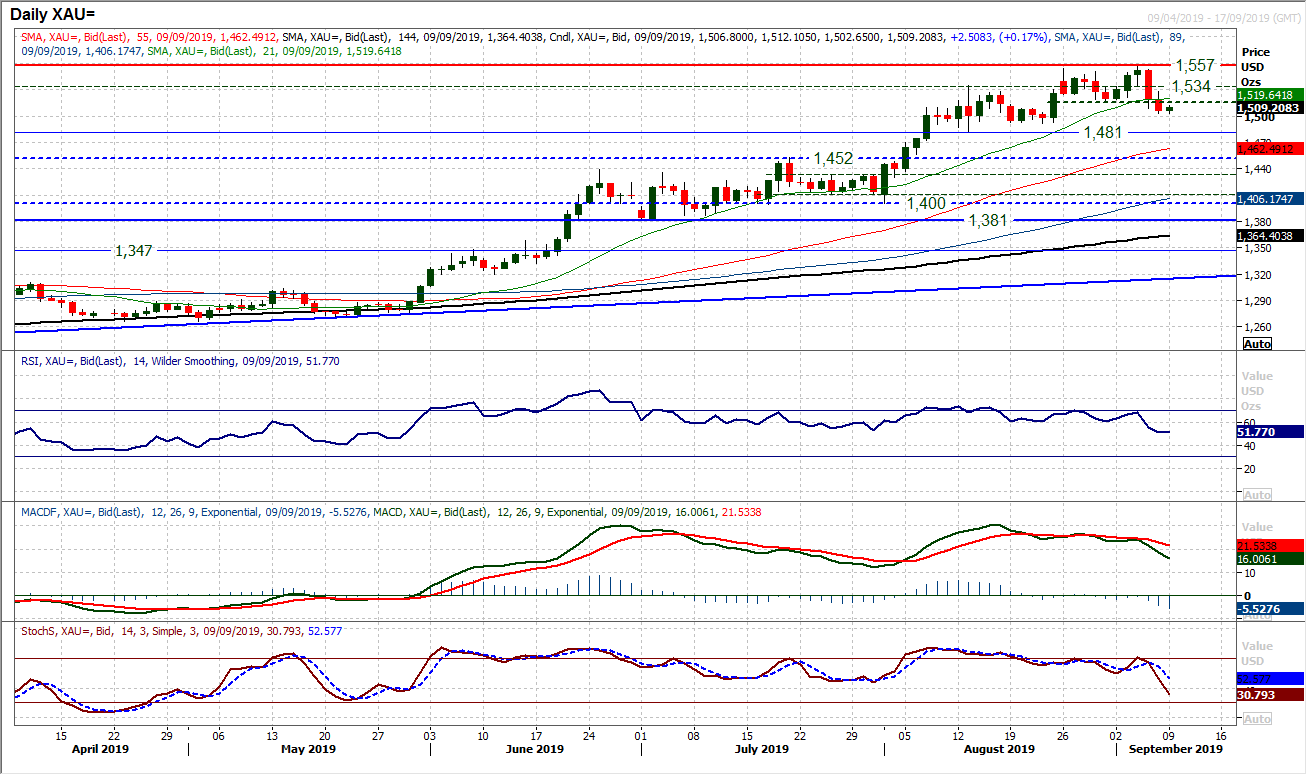
The outlook is still very questionable as the market continues to get to grips with Thursday’s sharp corrective sell-off. A second consecutive negative candlestick coupled with the close below $1517 and what is a growing deterioration in momentum shows that the bulls are really under threat now. The market is very much at a crossroads now. The 21 day moving average has been a key gauge of support since May, but is up around $1520 today and is beginning to potentially top out. Momentum is also on the brink with the RSI which is edging into the low 50s, which is a shade below where the bulls picked up again back in early August. Furthermore, Stochastics and MACD lines are accelerating lower in a more negative configuration than we have seen for months. There needs to e a bull reaction, otherwise the key support band $1481/$1492 will be threatened. An early tick higher needs to start closing back above resistance $1.517/$1527 to regain some positive momentum again.
WTI Oil
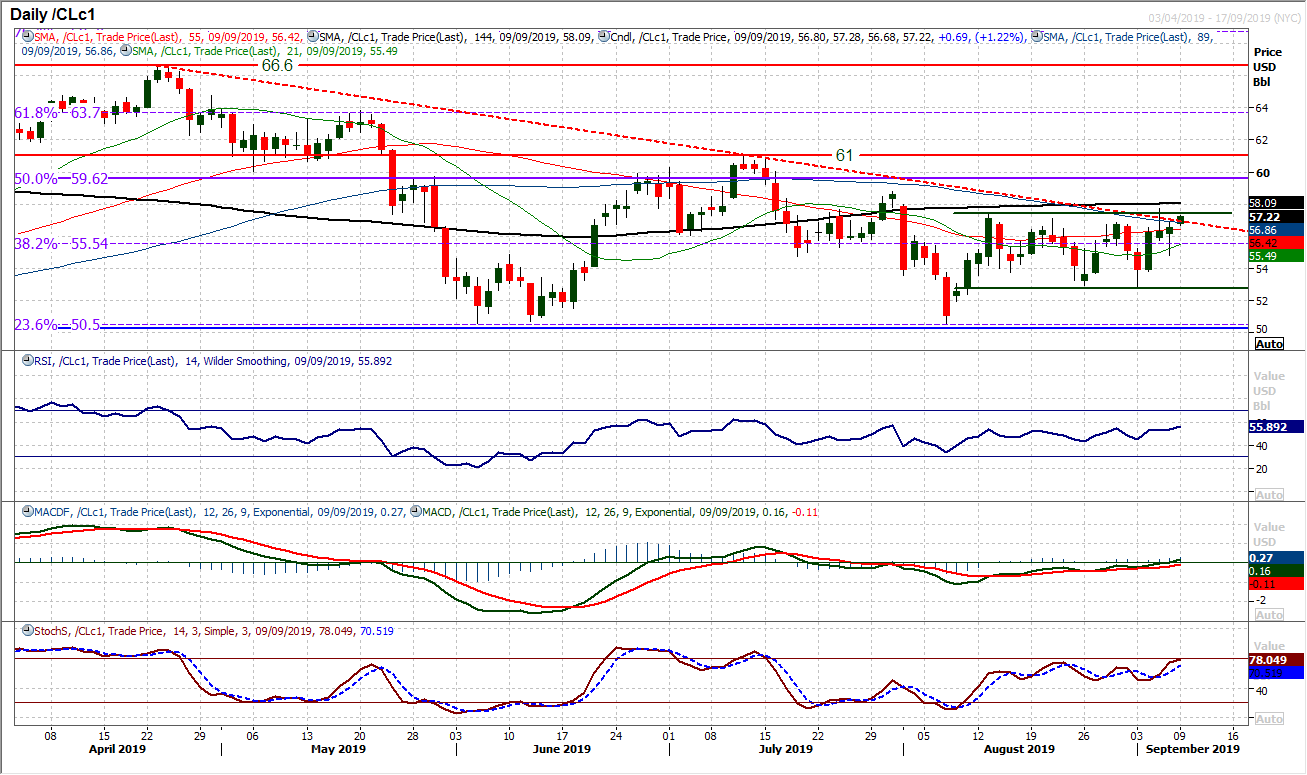
There is more of a positive vibe running through oil right now. The market has been ranging sideways for the past four weeks but there have now been three consecutive closes which are threatening the resistance of a four and a half month downtrend but also a potential bullish break of the range. Momentum indicators are matching the bull threat, but are not yet calling for a breakout. The RSI is in the mid-50s testing six week highs, whilst MACD lines are ticking higher towards neutral and Stochastics are positively configured (but without yet being overly bullish). This is a crossroads moment for oil. A close above $57.50/$57.75 resistance would be a key move, whilst the bulls would be in real control above $58.80. The hourly chart shows support around $56.50/$56.70 and holding above here continues to bullish pressure. Below $54.80 would be a disappointment now.
Dow Jones Industrial Average
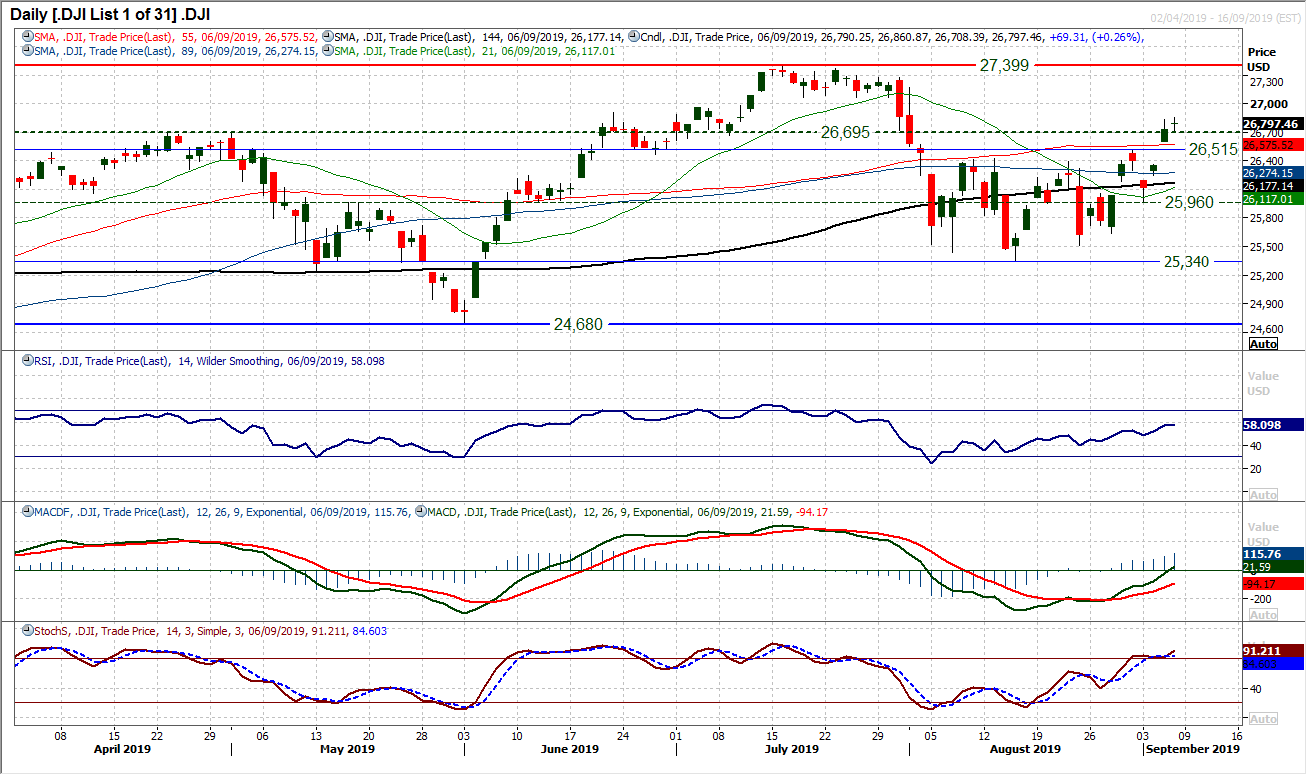
The Dow saw a session of consolidation on Friday as the bulls looked to build on the breakout. Closing in the previous session above the 26,515 resistance for a one month high the bulls are now eyeing the all-time high of 27,399 once more. Coming with the momentum indicators increasingly positively configured, the bulls are growing in confidence. The RSI is in the high 50s, whilst MACD lines are accelerating higher around neutral now, and the Stochastics are strong. Whilst Friday’s session may not have shot the lights out (a mixed payrolls report left traders a little flat), it is important for the market to build support above the breakout support band 26,425/26,515. Near term and intraday corrections will be seen as a chance to buy now. Friday’s low at 26,708 is initial support, whilst there is little real resistance until the late July high at 27,281.
Author

Richard Perry
Independent Analyst


