Safe haven bid is slowing as the dollar regains ground

Market Overview
The geopolitical driven safe haven bid is still in the market, however with the dollar regaining ground, is the move beginning to show signs of slowing? North Korea has dismissed Trump’s bluster as a “load of nonsense” and financial markets are beginning to ease on the fears that had surfaced 24 hours ago. The spike higher that saw VIX volatility up to 12.6 unwound into the close last night to 11.1, whilst on Wall Street initial selling pressure unwound with markets only slightly down on the day. In currencies, the yen has pulled back and the Swissy has also corrected back. Treasury yields have bounced higher again and it is only really gold that has maintained its bid. Can this move last? My feeling is that as the tensions subside, then the moves of the past 24 hours will also. Markets tend to settle down fairly quickly with geopolitical shocks and this one seems to be a while load of posturing. The big caveat to that is that the players are so inexperienced in this game of foreign policy that their bravado could stumble into a conflict situation. One would hope that even a narcissist like Donald Trump would not be that stupid.

Wall Street closed only marginally lower in the end with the S&P 500 well off its lows and almost flat on the day at 2474. Asian markets have though been mixed to lower with the Nikkei -0.1%. European markets are still cautious in early moves. In forex, the dollar seems to be regaining its poise once more today, outperforming several majors (also notably the Swissy), although the yen is holding firm still. The Kiwi has dropped strongly in the wake of the RBNZ monetary policy which was still on the dovish side with no rate hike from 1.75% (as expected) and noting that inflation would rise gradually. Gold has held up well in the face of a strengthening dollar today, whilst oil is also holding on to yesterday’s gains in the wake of the EIA inventories.
As we get ever closer to the end of the week the focus will turn back on US inflation trends. However first of note is the UK Industrial Production at 0930BST which is expected to improve marginally on the month with +0.1% MoM, but this would still show a year on year decline of -0.1% (up from -0.3% last month). The UK trade balance is also at 0930BST and is expected to improve slightly to a deficit of -£11.0bn (from -£11.9bn). The main focus will be on the US factory gate inflation, the US PPI which is released at 1330BST. The expectation is that PPI is expected to tick higher to 2.2% on headline (up from +2.0%) with the core PPI expected to increase to +2.1% (from +1.9%).
Chart of the Day – AUD/USD
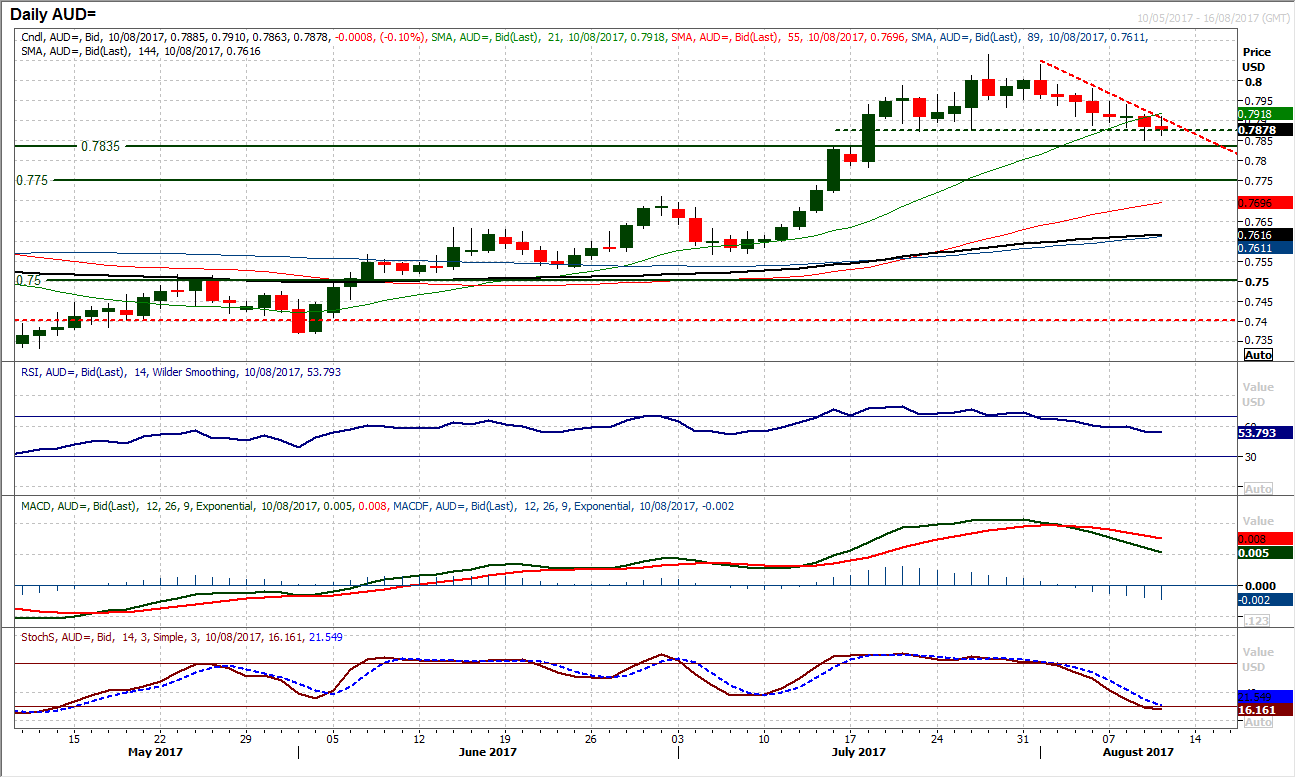
The Aussie seems to have topped out in the past couple of weeks as the market has fallen back from the July high of $0.8065. For over a week now the market has been posting consistent lower highs to form a new downtrend and there has been pressure on the key near term support at $0.7875. This has been a neckline of a potential top pattern no for a couple of weeks and an intraday breach of the support yesterday suggests that the selling pressure for a breach is building. Although the market failed to close below the support, the momentum is accelerating in the correction and a closing breach of $0.7875 would now complete the top. This would then imply a continued correction of another 190 pips to $0.7685 and would certainly suggest that a retreat to the old key breakouts at $0.7750 would be possible. This comes as momentum indicators turn increasingly corrective on the daily chart, with the MACD and Stochastics lines accelerating lower. The RSI below 50 would also be a two and a half month low. The hourly chart shows that $0.7900/$0.7940 is now a sell zone, with the sellers ony losing control on a break back above $0.7980. The hourly momentum is also corrective with the RSI failing around 60 and the MACD lines habitually now under neutral. The initial support is $0.7850 with $0.7835 the old key April 2016 high which is now supportive.
EUR/USD
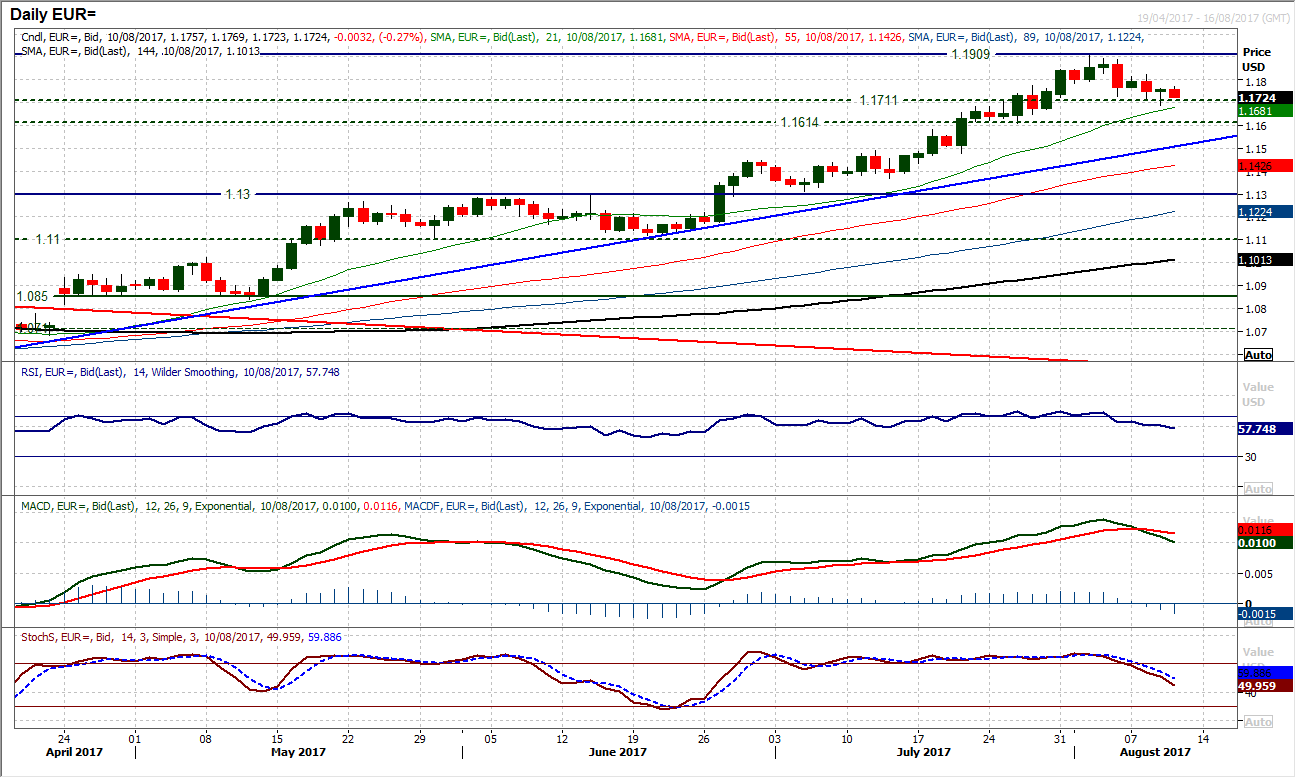
The market continues its corrective slide which dates back over a week now from the high of $1.1909. The momentum indicators continue to unwind on this move and all are now in increasingly corrective configuration. However, this is a correction within the uptrend rather than a bear move. The unwind seems to be all rather orderly at the moment, with small real bodies on the candles throughout this week. The support of the breakout at $1.1711 (the old key August 2015 high) was briefly breached yesterday only for the bulls to kick back in again, however once more this morning the support is under pressure. A breach on a closing basis would continue the slide and re-open $1.1614 (the old key May 2016 high), whilst the support of the four month uptrend comes in at $1.1520 now. The hourly chart shows negatively configured near term momentum with the RSI failing at 60 and MACD lines failing under neutral. There are also lower highs in place with $1.1770 initial resistance under $1.1825. Yesterday’s low at $1.1687 is also a near term gauge.
GBP/USD
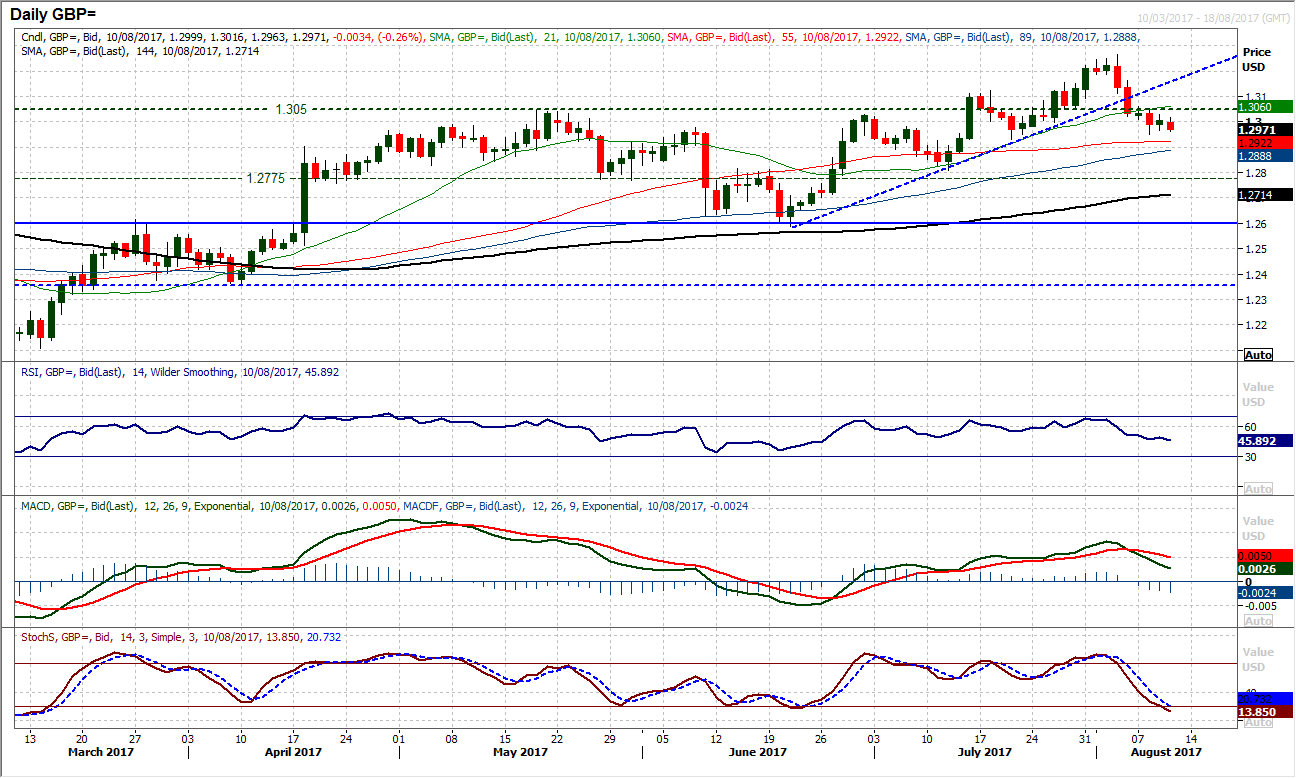
After yesterday’s brief interlude the dollar improvement seems to be back on track today. A very mild positive candle seems to have done little to hold up the corrective pressure on Cable that has been building in the past week. The RSI is now falling below 50, the MACD lines are in decline and the Stochastics are also into negative near term configuration. The market seems ready to test the support at $1.2930 which is the first real support of the previous uptrend, with a breach opening the July low at $1.2808. Aside from the strength of the bear candles forming during this unwinding move, the market is also posting a sequence of lower daily highs, meaning that yesterday’s high at $1.3030 is initially the resistance to watch. It seems that having previously been a band of support, the bulls are now struggling in the $1.3000/$1.3050 range. The hourly chart shows negatively configured corrective momentum, with the RSI failing around 60 and moving below 30, whilst the MACD lines are failing around neutral. On a near term basis, selling into strength has become the strategy and exactly how the market reacts to these July lows will determine how long the correction lasts for.
USD/JPY
The key issue for the safe haven plays is how long the bid from the raised geopolitical tensions will last. Two bearish candles have now been completed, however interestingly, the yen has already lost some of its impetus with a rebound from the 109.53 low. For a while I have been talking about a retreat to the 50% Fib level at 109.35 and probably a test of the Jun lows at 108.80. However, momentum is key in these moves and can often quickly unwind (especially as the dollar had been picking up prior to the geopolitical tensions). Yesterday’s candle closing well above the mid-point suggests that the sellers are not in complete control. The market has dropped a touch back again today but a close below 109.82 (last week’s low) is needed to increase the confidence of the sellers. Daily momentum seems to be losing its downside impetus. Following yesterday’s rebound, the session today could be telling. The hourly chart shows resistance initially at 110.20, a pivot at 110.60 and then the key near term barrier around 111.00.

Gold
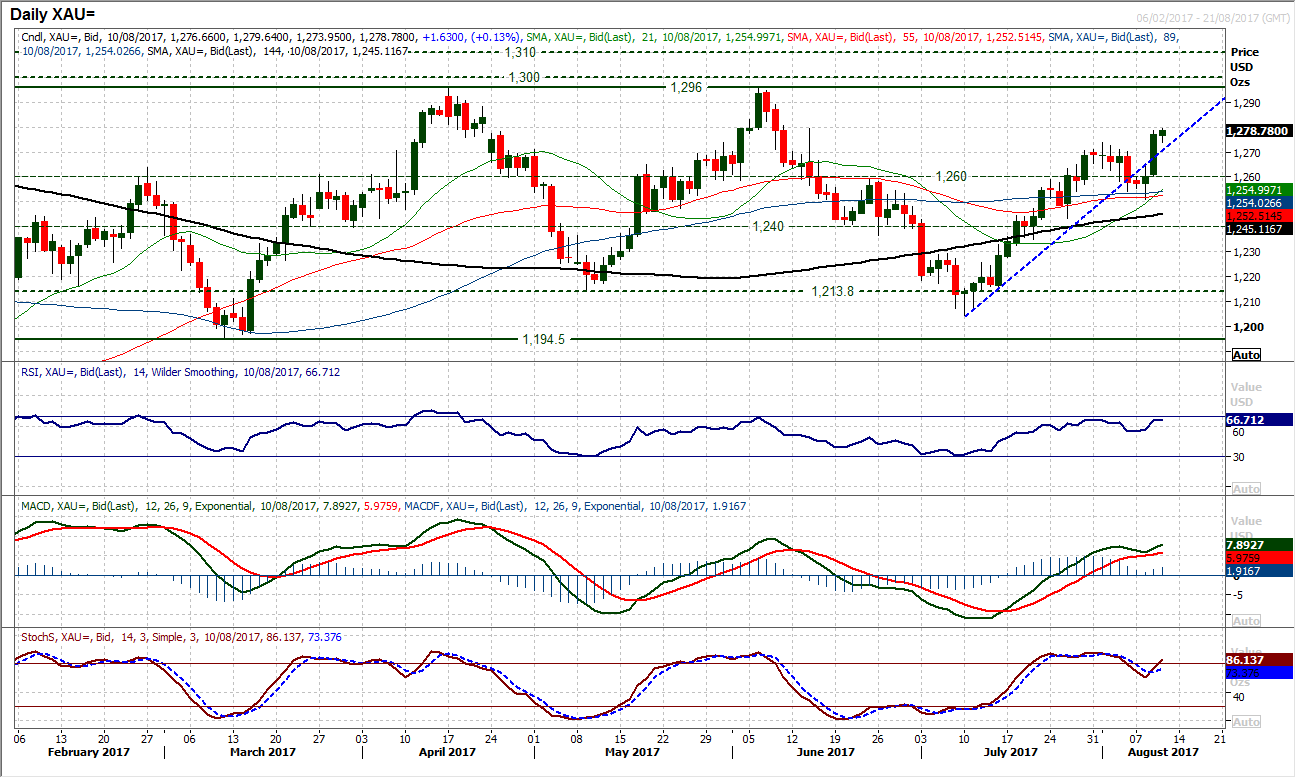
The safe haven bid for gold arising from the geopolitical tensions have driven the market through the resistance at $1274. With a strong bull candle and early gains today, the buyers are in the driving seat. It will be interesting to see how long this geopolitical induced breakout can last (especially if the tensions begin to subside). Technically the breakout is strong and momentum indicators have reacted accordingly. The breakout above $1274 means the only real resistance preventing a move back to the key June high at $1296 comes in at $1279.40 and is being tested this morning. The hourly chart shows the near term breakout previous resistance between $1271/$1274 is now supportive. This is largely a news driven breakout, so keep close to the story.
WTI Oil
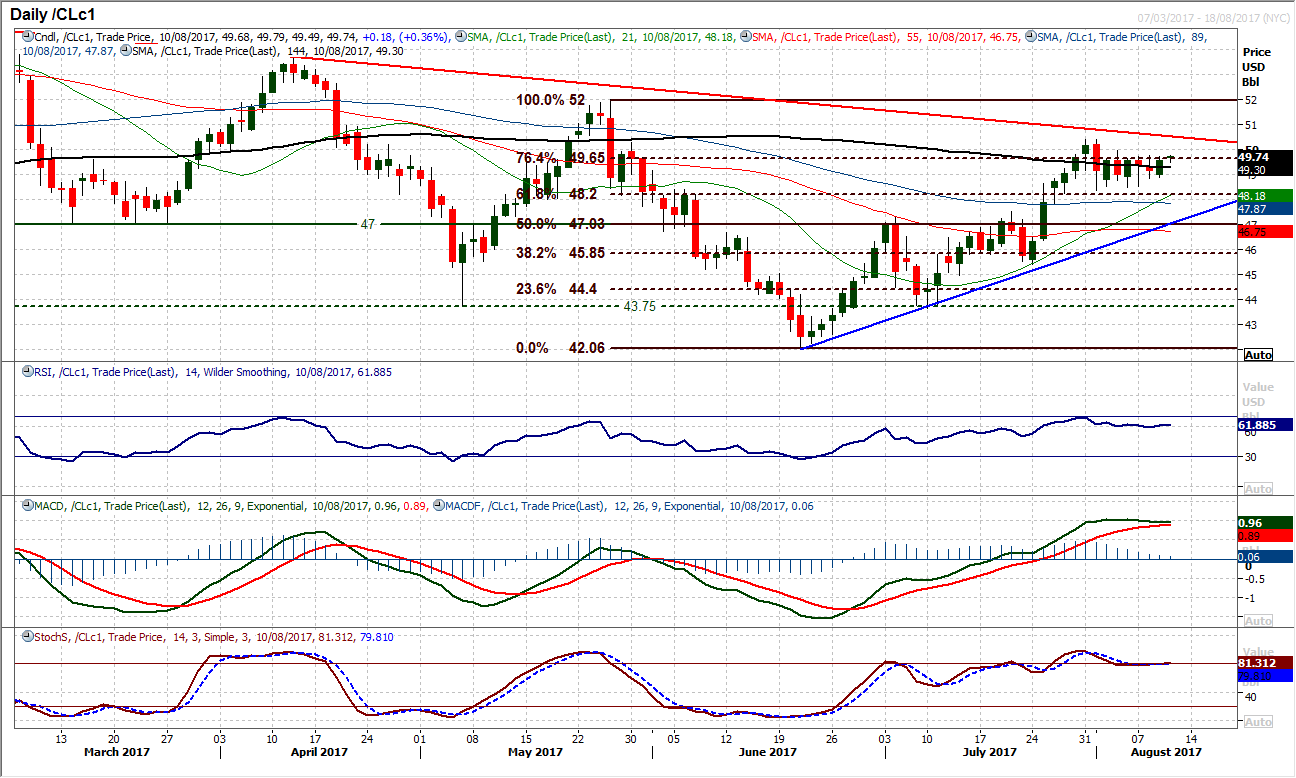
The market has taken the positives out of the mixed EIA inventories (larger than expected crude oil drawdown, but higher than expected gasoline build) to post a solid bull candle yesterday. This is helping to bolster the support around $48.37 and the market is again testing resistance that has been in place throughout this week at $49.65/$49.95. This is a resistance that also protects the August high at $50.43. Increasingly, it is interesting that this consolidation is around the 76.4% Fibonacci retracement at $49.65. The momentum is positively configured on a medium term basis, but is struggling with the consolidation. However, as with the range of the past couple of weeks, until a breach of $48.37 support, or a move above the $50.43 resistance, there is little real direction to be garnered from recent trading. This is reflected very much in the hourly momentum indicators which are range bound.
Dow Jones Industrial Average
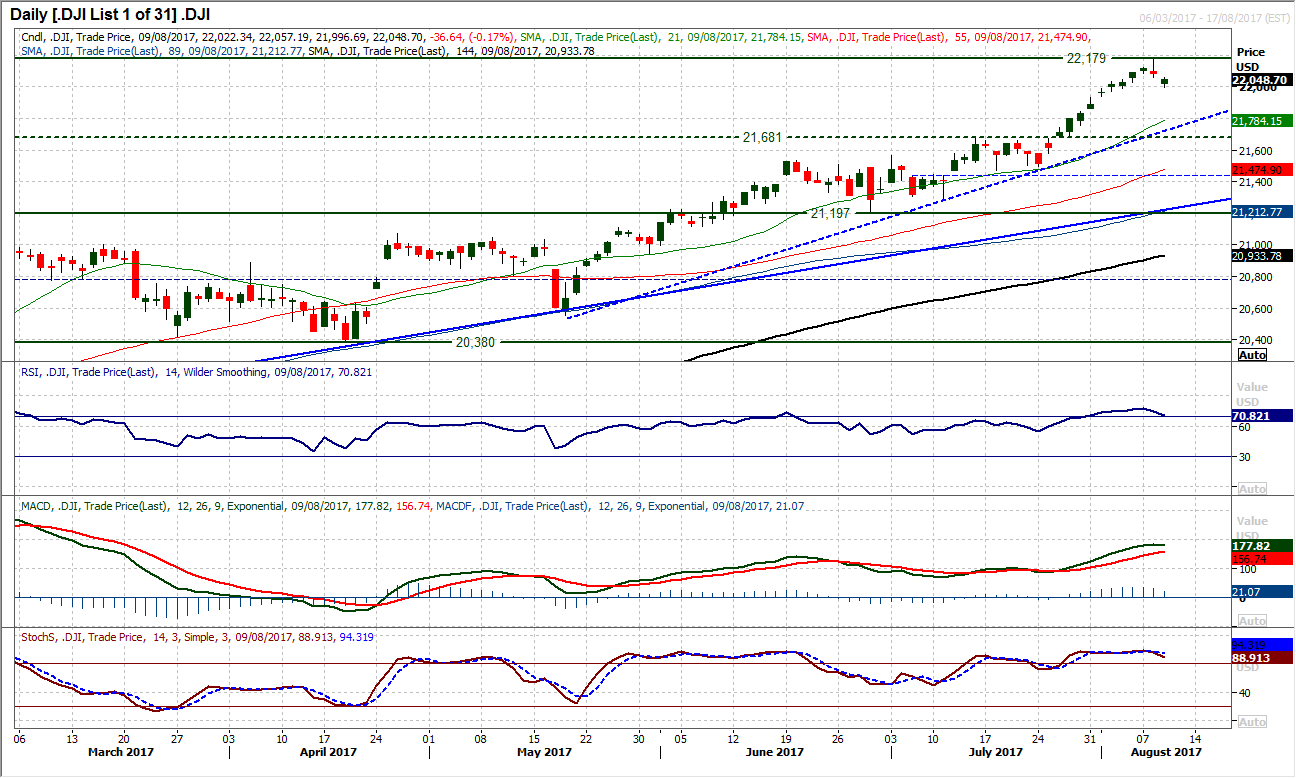
The bulls have, at least temporarily, lost control. The market has now posted a second negative session and the momentum indicators are turning corrective. With the Stochastics falling, the RSI is close to being the first of the momentum indicators to give a formal profit-taking signal, needing a cross back below 70 (a basic sell signal). The market is now posting lower daily highs and lows in a fairly orderly retreat. The support of a three month uptrend comes in at 21,720 and if the RSI unwinds back towards 50 where the July unwind reached, then a retreat to the uptrend is perfectly within reason. Certainly, for now, this would be a correction that would be seen as another chance to buy. There is little real support as the market all but went steadily higher during the run. A move below the psychological 22,000 level would open a retracement to the 38.2% Fibonacci of the 21,496/22,179 rally at 21,918.
Author

Richard Perry
Independent Analyst


