Russell 200 -

NOVEMBER’S IMPULSE PATTERN COMPLETED AT 1560.00! – WATCH FOR BEARISH DIVERGENCE DJIA

Many investors believe the Russell 2000 small-cap index leads the price movements of the large-cap indices like the S&P and Dow Jones (DJIA), but the reality is that its relationship is often inconsistent. Yes, sometimes it does ‘lead’ but on other occasions, it ‘lags’ too. That doesn’t make it a redundant indicator, it just means that bullish/bearish divergences will occasionally alternate depending on the market forces at the time.

As all major U.S. indices approach important upside targets that end 3rd wave sequences within the five wave impulse pattern developing from the Feb.’16 low, it’s important to watch for bearish divergences between the small-cap Russell 2000 and the S&P and Dow.       

August’s Impulse Completed

The Russell 2000’s five wave impulse upswing from last August’s low of 1348.80 (futures) represents the fifth wave within the larger 3rd in progress from the June ’16 Brexit low – see fig #1. As you can see from this chart, this fifth wave, labelled as minuette wave [v], subdivides into a smaller impulse sequence, (i)-(ii)-(iii)-(iv)-(v). It has structurally satisfied completion already, into the early-December high of 1561.90.

Russell

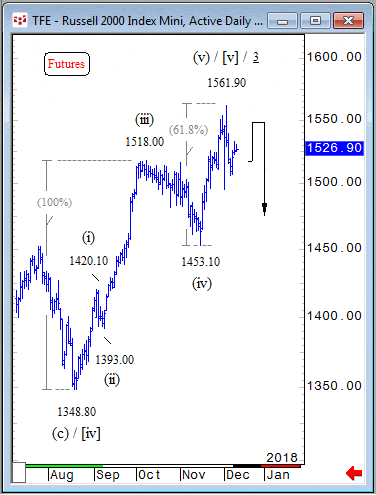
This can be verified using Fib-Price-Ratios – for example, wave (v) unfolds by a commonly recurring fib. 61.8% ratio of waves (i)-(iii) at 1561.90, just 1.3 points from the ‘idealised’ measurement. It has subsequently traded lower to 1506.70, enough to qualify a reversal-signature.

As things stand, the S&P is scheduled to make a bid to a slightly higher-high later this week before it also triggers a ‘reversal-signature’ decline, so it will be interesting to see of some short-term bearish divergence occurs between these two.  


Conclusion

Short-term bearish divergence can be misleading but this depends on the Elliott Wave pattern structure. An index could simply be lagging, as the Russell was back in October/November, but now that pattern alignment with the S&P has occurred, any sign of bearish divergence at this juncture becomes much more interesting.


Subscribe and get the latest forecasts on Stocks, FX & Commodities – NOW!

WaveTrack International and its related publications apply R.N.Elliott's "The Wave Principle" to historical market price activity which categorises and interprets the progress of future price patterns according to this methodology. Whilst it may be reasonable to deduce a course of action regarding investments as a result of such application, at no time or on any occasion will specific securities, futures, options or commodities of any kind be recommended for purchase or sale. Publications containing forecasts are therefore intended for information purposes only. Any opinion contained in these reports is only a statement of our views and are based on information we believe to be reliable but no guarantee is given as to its accuracy or completeness. Markets are volatile and therefore subject to rapid an unexpected price changes. Any person relying on information contained in these reports does so at their own risk entirely and no liability is accepted by WaveTrack in respect thereof. © All rights are copyrights to WaveTrack. Reproduction and / or dissemination without WaveTrack's prior consent is strictly forbidden. We encourage reviews, quotation and reference but request that full credit is given.

Recommended Content


Recommended Content

Editors’ Picks

EUR/USD edges lower toward 1.0700 post-US PCE

EUR/USD edges lower toward 1.0700 post-US PCE

EUR/USD stays under modest bearish pressure but manages to hold above 1.0700 in the American session on Friday. The US Dollar (USD) gathers strength against its rivals after the stronger-than-forecast PCE inflation data, not allowing the pair to gain traction.

EUR/USD News

GBP/USD retreats to 1.2500 on renewed USD strength

GBP/USD retreats to 1.2500 on renewed USD strength

GBP/USD lost its traction and turned negative on the day near 1.2500. Following the stronger-than-expected PCE inflation readings from the US, the USD stays resilient and makes it difficult for the pair to gather recovery momentum.

GBP/USD News

Gold struggles to hold above $2,350 following US inflation

Gold struggles to hold above $2,350 following US inflation

Gold turned south and declined toward $2,340, erasing a large portion of its daily gains, as the USD benefited from PCE inflation data. The benchmark 10-year US yield, however, stays in negative territory and helps XAU/USD limit its losses. 

Gold News

Bitcoin Weekly Forecast: BTC’s next breakout could propel it to $80,000 Premium

Bitcoin Weekly Forecast: BTC’s next breakout could propel it to $80,000

Bitcoin’s recent price consolidation could be nearing its end as technical indicators and on-chain metrics suggest a potential upward breakout. However, this move would not be straightforward and could punish impatient investors. 

Read more

Week ahead – Hawkish risk as Fed and NFP on tap, Eurozone data eyed too

Week ahead – Hawkish risk as Fed and NFP on tap, Eurozone data eyed too

Fed meets on Wednesday as US inflation stays elevated. Will Friday’s jobs report bring relief or more angst for the markets? Eurozone flash GDP and CPI numbers in focus for the Euro.

Read more

Majors

Cryptocurrencies

Signatures