Risk appetite ticks higher again with the glass now half full [Video]
![Risk appetite ticks higher again with the glass now half full [Video]](https://editorial.fxstreet.com/images/TechnicalAnalysis/Sentiment/RiskAppetite/parachute-jumping-72480495_XtraLarge.jpg)
Market Overview
Traders have struggled to make sense of positioning for risk over the past week. A range of conflicting reports surrounding the US/China trade dispute has thrown sentiment from pillar to post. There is an element of fatigue that is setting in now, however the latest swing to a more positive line of negotiation (as reported in the South China Morning Post – effectively a mouthpiece for the Chinese government) leaves traders coming to the end of the week with a glass half full. If only the constant stream of contradictions could simmer down then perhaps market could start to trend once more. With Treasury yields uncertain, forex majors have taken on increasingly ranging characteristics. VIX volatility is off its recent multi-month lows as Wall Street has also been shaken out of its pleasant dream of all-time highs. There is still a sense that Dollar/Yuan is a market to keep as a gauge (trading above 7.00 suggests a degree of caution still over the trade dispute). Yield spreads on the US Treasury curve are also a gauge too, as they tighten/narrow again it is another indication of cautious sentiment. For today, the glass is half full and we see the dollar slipping again along with equities higher. Can it last into the weekend? Newsflow surrounding President Trump and the Congressional Bills over Hong Kong could be key. The flash PMIs add to the indicators of risk today.
Wall Street closed another session in mild correction (albeit relatively contained again) with the SP 500 -0.2% at 3103. US Futures are a shade higher early today (+0.1%), with Asian markets mixed overnight (Nikkei +0.3%, Shanghai Composite -0.6%). In Europe, there is a cautious to positive start today, with FTSE futures +0.4% but DAX futures are flat. In forex, we see a continuation of the uncertain outlook, with the slightest edge of USD weakness, although certainly not enough to take a view. In commodities again a tick back higher on gold is suggesting a lack of conviction in yesterday’s slip lower. Oil is unwinding some of the huge gains of recent days.
There is a big focus on the forward-looking flash PMIs for the Eurozone and US today to give a first look at how these economies are faring in November. The Eurozone flash Manufacturing PMI for November is at 0900GMT and is expected to show a pick up to 46.4 (from 45.9 final in October). Eurozone flash Services PMI is expected to also tick higher to 52.5 (from 52.2). This is expected to all improve the Eurozone flash Composite PMI to 50.9 (from 50.6). In the US the flash Manufacturing PMI is at 1445GMT which is expected to improve to 51.5 (from 51.3 in October) along with the US flash Services PMI to improve to 51.0 (from 50.6 in October). Also keep an eye out for the final reading of the Michigan Sentiment gauges at 1500BST which are expected to confirm at 95.7 (95.7 November prelim Sentiment, up from the 95.5 final October reading).
Today is also the first real speech for new ECB President Christine Lagarde. Having avoided sensitive monetary policy in a previous speech traders will be looking for a more meaty speech this time round.
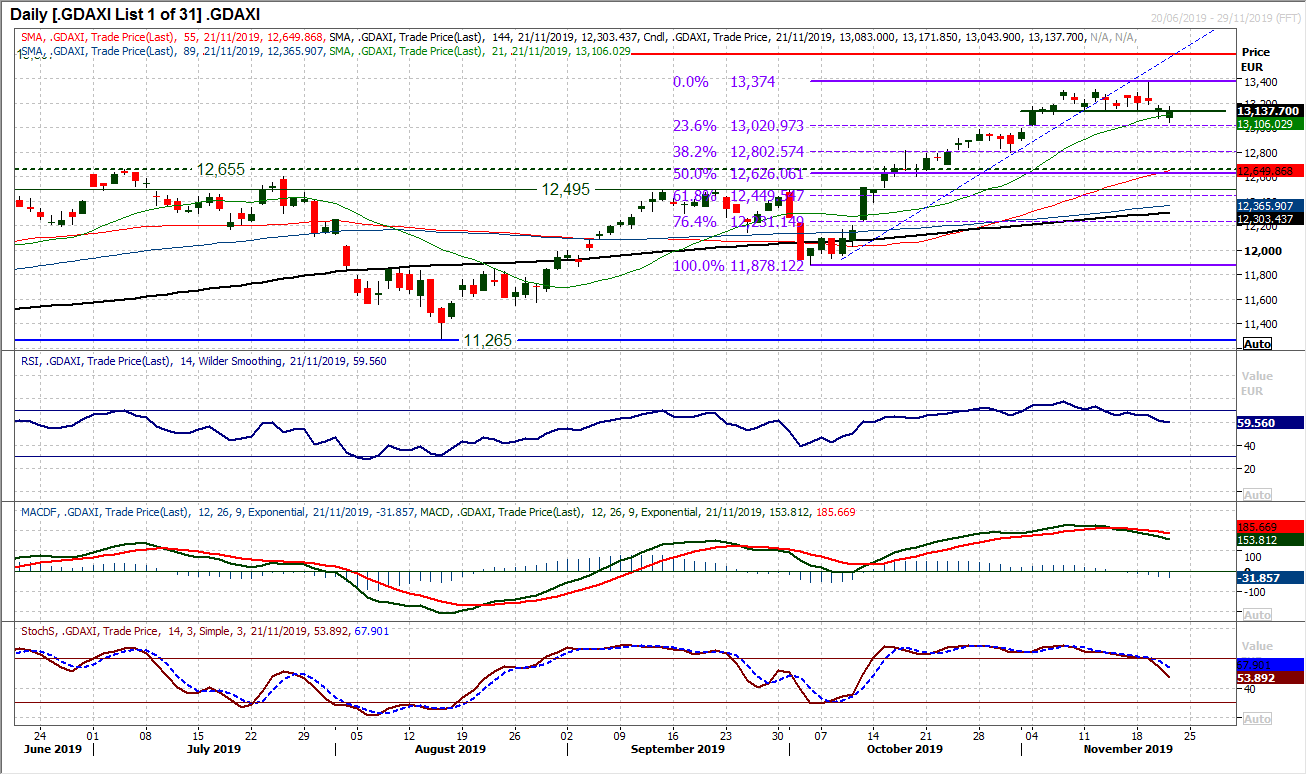
Chart of the Day – DAX Xetra
With indices in Europe under pressure in recent days, there are corrective forces threatening, but will they take hold?. The key is whether the bulls can continue to fight against the profit-takers. Since the false upside break earlier this week formed a bearish shooting star candlestick, the breach of support around 13,135/13,140 for a two week low suggests a topping out. With a gap at 13,188 all but filled, there is a resistance now 13,135/13,190. With futures stable today, reaction in this resistance band could be key near term. The corrective momentum is already driving MACD lines lower from a bear cross, whilst a confirmed sell signal accelerates lower on the Stochastics. The bulls will point to two consecutive sessions where intraday weakness has been bought into however, there also seems to be a new line of selling into strength. If the correction does take hold, watch the Fibonacci retracements (of the 11,878/13,374 rally). They come around key levels, with 23.6% Fib at 13,020, but more importantly the 38.2% Fib level is around 13,800 and the October pivot. Given how the hourly momentum configuration is looking more correctively configured now too, the bulls will need to fight hard to restrict the near term corrective move from gathering pace.
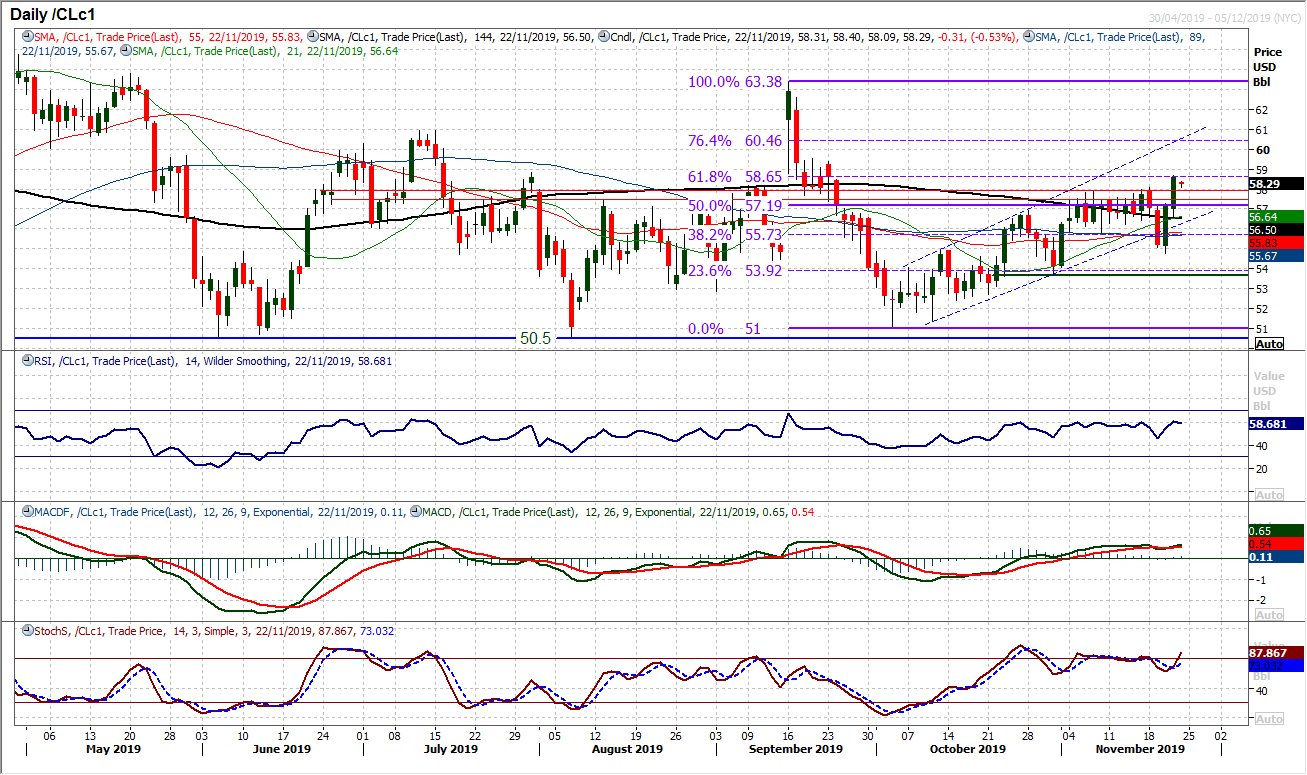
WTI Oil
Newsflow has really thrown oil around this week. Various press reports on OPEC production (first lower on supposed Russian objection to further cuts, then higher on larger than expected EIA inventory drawdown, to then higher still on Reuters reports on a three month extension to OPEC cuts). A wild ride for trades leaves the chart somewhat messy. Trendlines broken, along with false breaks on both supports and resistances. It was interesting to see the 61.8% Fib level at $58.65 providing the resistance yesterday almost to the tick before the market has retraced again today. Contradictory newsflow on US/China trade remains a swing factor for oil. Technically though, despite the channel being breached earlier this week there is still a run of higher lows and higher highs. If the bulls can hold on to the support band $57.50/$57.85 then the bulls will be happy. Above 61.8% Fib opens 76.4% Fib around $60.45.
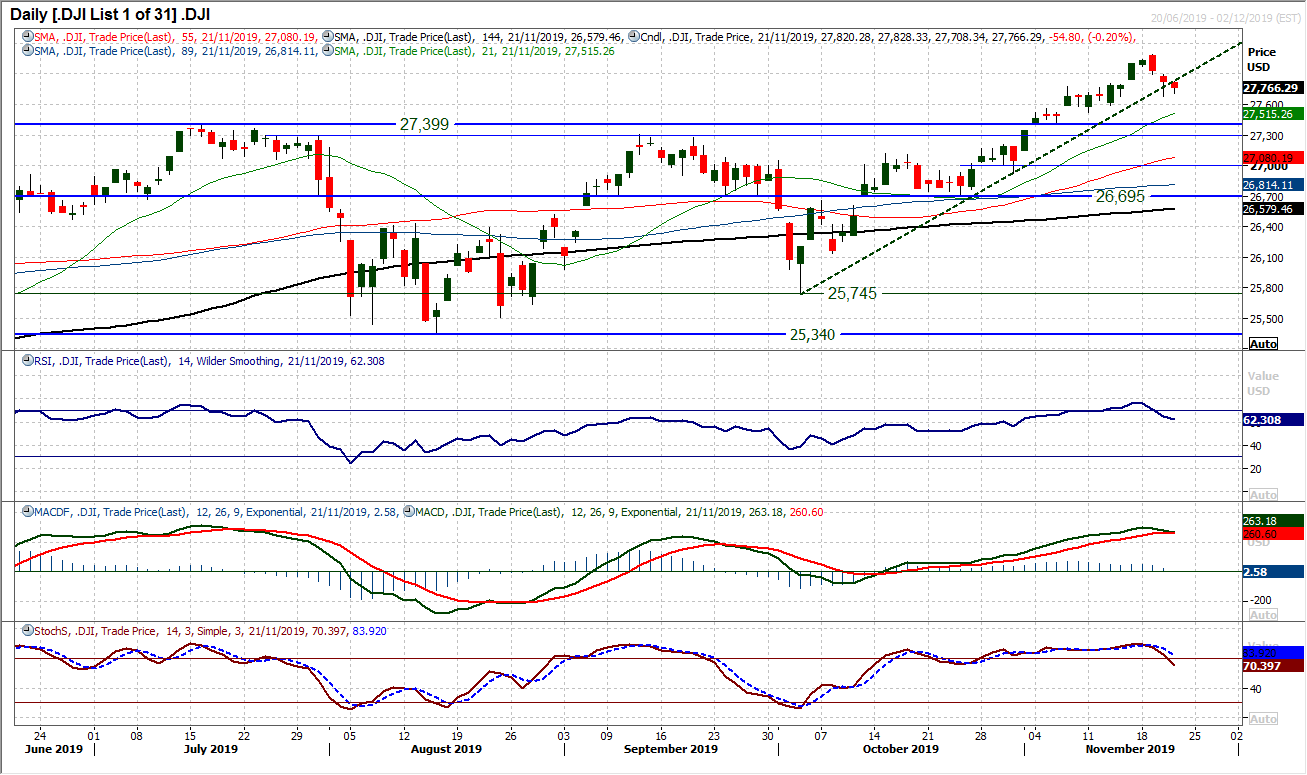
Dow Jones Industrial Average
In the past few days we have seen the Dow gradually unwind some of its gains of the recent weeks, however, this seems to be a move that is relatively contained. It is still likely that it will be another chance to buy in due course. Three negative closes (and candlesticks) in a row has not been seen since early August and runs the risk of inducing profit-taking to turn into something more malign. However, whilst there has been a mild deterioration on momentum indicators, there is still little conviction in the move lower. A seven week uptrend has been breached, the RSI below 70 and the Stochastics dropping back, but essentially that is it of the negative signals. Yesterday’s mild negative close was an “inside day” of Wednesday as support at 27,675 held all day. The hourly chart shows little real driving corrective momentum, and if anything a consolidation potentially turning higher again. With futures stabilising today, a move above resistance initially at 27,836 would point to the bulls getting a foothold on the market again. The all-time high at 28,090 is key resistance.
Other assets insights
EUR/USD Analysis: read now
GBP/USD Analysis: read now
USD/JPY Analysis: read now
GOLD Analysis: read now
Author

Richard Perry
Independent Analyst


