Rising Miners, Gold and Countdown to the Fed

Both gold and silver moved higher yesterday but it were the miners that spiked. Looking at the last few sessions, have these moves changed anything? The FOMC releases its decision today, the markets are hesitating to move and it’s nothing surprising. It is usually the case on Fed days (and around them) that we see increased intraday volatility that doesn’t necessarily mean anything. Does it describe today’s situation also?
The explanation is quite straightforward. Overall, the investors and traders are not sure what will happen, but some of them are trying to bet on a more hawkish and some on a more dovish outcome. Large transactions trigger initial moves and other investors quickly jump in as they fear missing out on the trade that is “just unfolding”.
In reality, rarely any trade is really unfolding just before the news is released – the very short-term and volatile moves are just like people that run around because they can’t sit in place while waiting for something or someone. This running around doesn’t indicate a start of a journey, and the very short-term up- and downswings right before the major news is released can be just as informative – barely so. Unless the markets are significantly surprised, the preceding trends are likely to be continued after the interest rate decision is made and the dust settles. And the preceding trend in the precious metals market remains down. Let’s keep in mind that even though gold moved significantly up in the last couple of months, silver and gold stocks and silver stocks moved just a little higher from the long-term point of view. In other words, most of the precious metals sector didn’t rally significantly in recent months.
Let’s take a few questions and answer them looking at the charts.
Precious Metals, Miners and Yesterday’s Session
But maybe yesterday’s upswing changed anything in gold or silver?
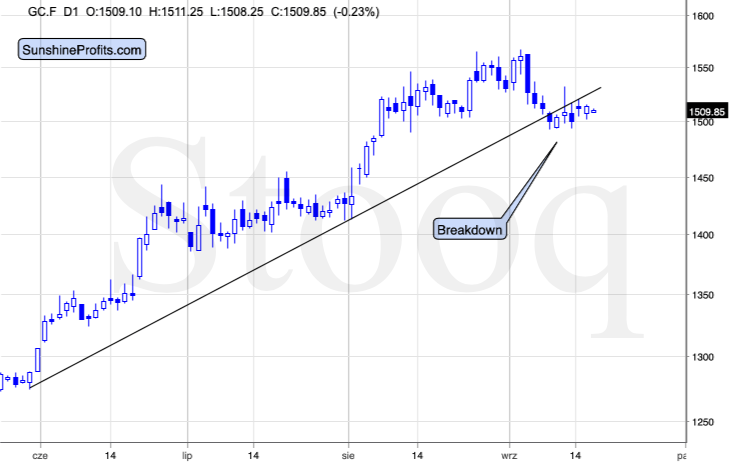
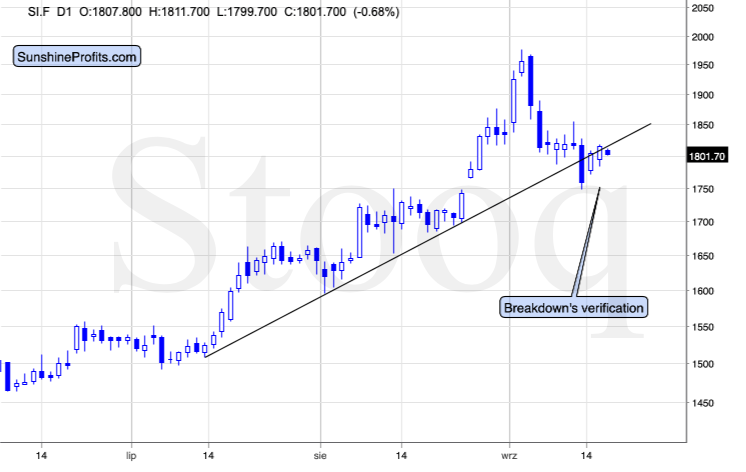
It didn’t. Just as gold and silver were trading below their respective rising support lines on Monday, the same happened yesterday. Silver is down in overnight trading, which makes it clear that the breakdown was confirmed instead of being invalidated.
Of course, both metals – especially silver – could move higher once again today, but such a move would likely not last for more than a day or a couple of them. The few hours before and after the interest rate announcement and the following press conference could be particularly volatile. Please keep the above in mind if gold and silver move higher during this time – it will almost certainly be a fake move. In particular, silver is known for false breakouts, so it could be the case that it moves even above $18.50 today only to fall hard in the following days and weeks.
Of course, just because it is possible, it doesn’t mean that it’s likely. It’s best to be positioned in tune with the trend. However, it’s also good to be aware of the possibility that some chaotic movement might be seen on particular day, so that one doesn’t unnecessarily panic over a move that is unlikely to be meaningful or lasting.
Ok, but what about miners’ upswing? Doesn’t their strength indicate a rally is just around the corner?

Not really. Let’s keep in mind the following:
- The gold miners were first to break below their rising support line and they continued to underperform for days.
- Miners moved to the 38.2% Fibonacci retracement level based on the most recent upswing, which means that some kind of very short-term rebound was relatively likely
- It’s just one day of strong performance relative to gold and one swallow doesn’t make a summer.
Yesterday’s upswing falls into the “normal” category of the things that we might expect a market to do after decline that’s already quite sizable. Especially that the Fed’s interest rate announcement is today and some kind of increased short-term volatility is likely.
If miners continue to show strength while gold and silver invalidate their breakdowns, it might mean that we’ll see another short-term upswing before the decline resumes. At this time though, the odds continue to favor decline’s continuation without a meaningful move higher beforehand.
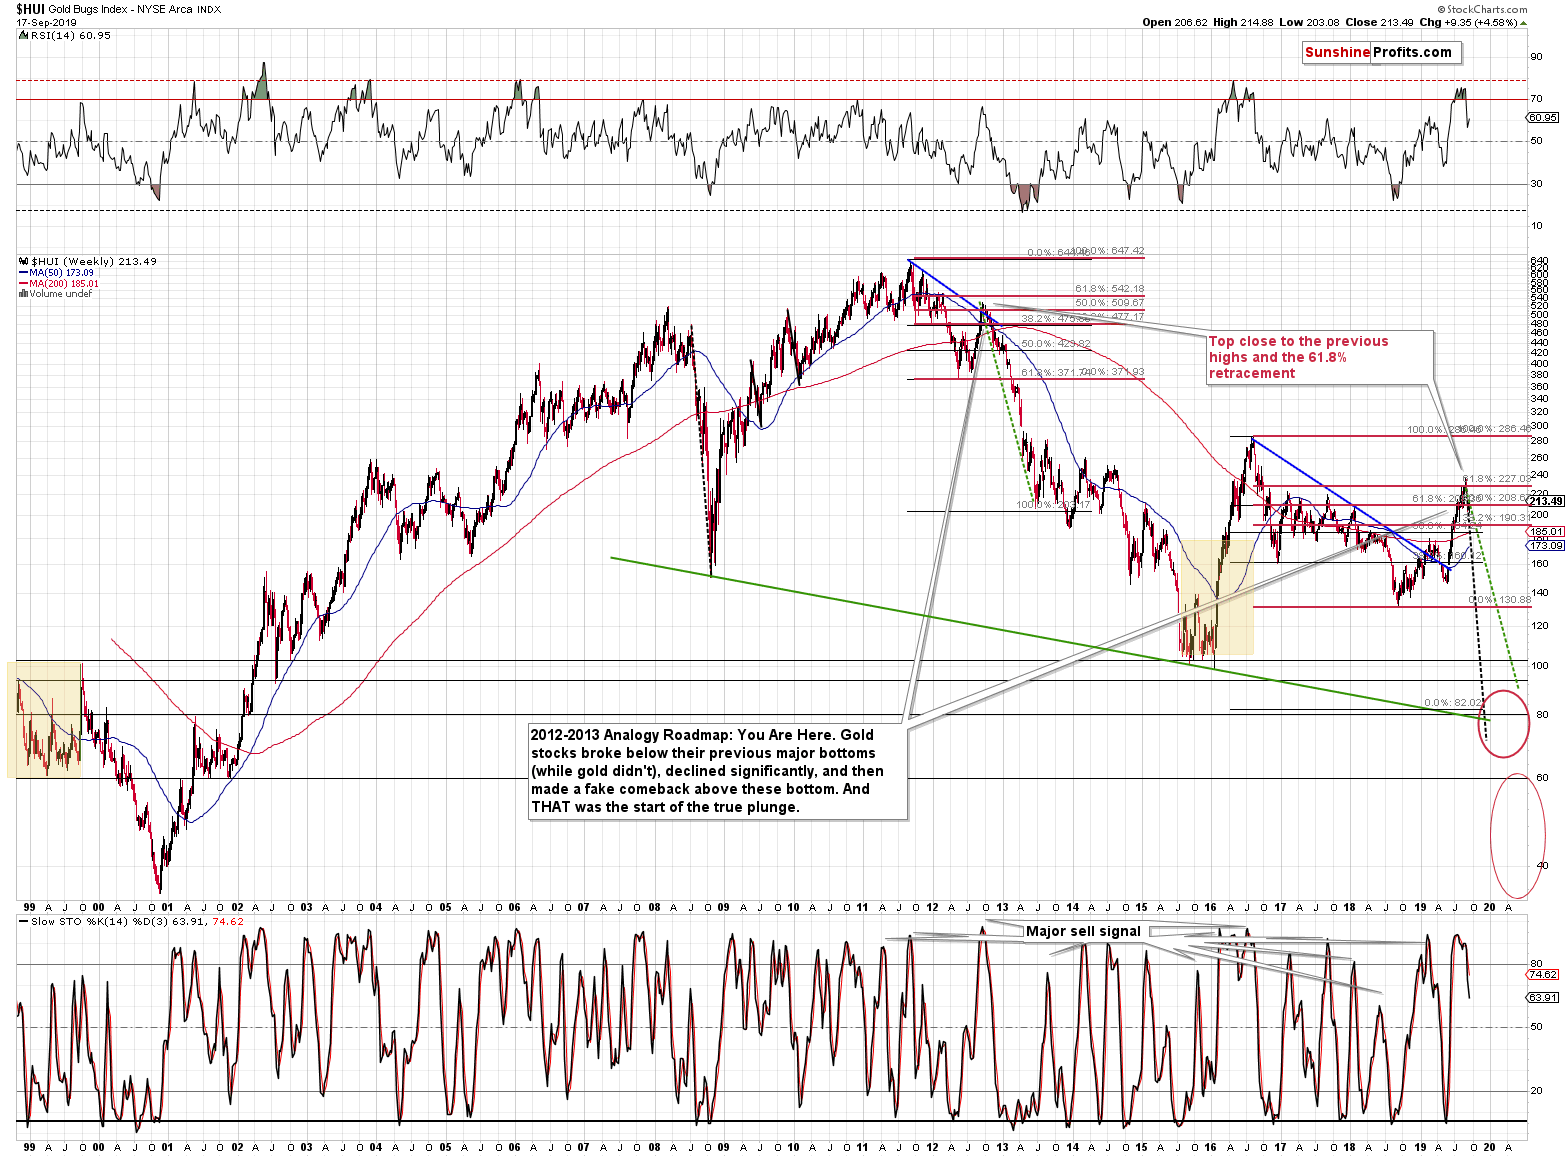
Besides, yesterday’s upswing in the gold stocks was barely visible from the long-term point of view. The HUI Index invalidated the small breakout above the 61.8% Fibonacci retracement and has been declining almost relentlessly ever since. Yesterday’s upswing is a barely noticeable breather in this decline.
Let’s recap the facts to pay attention to.
Key Factors to Keep in Mind
Critical factors:
- The USD Index broke above the very long-term resistance line and verified the breakout above it. Its huge upswing is already underway.
- The USD’s long-term upswing is an extremely important and bearish factor for gold. There were only two similar cases in the past few decades, when USD Index was starting profound, long-term bull markets, and they were both accompanied by huge declines in gold and the rest of the precious metals market
- Out of these two similar cases, only one is very similar - the case when gold topped in February 1996. The similarity extends beyond gold’s about a yearly delay in reaction to the USD’s rally. Also the shape of gold price moves prior to the 1996 high and what we saw in the last couple of years is very similar, which confirm the analysis of the gold-USD link and the above-mentioned implications of USD Index’s long-term breakout.
- The similarity between now and 1996 extends to silver and mining stocks – in other words, it goes beyond USD, gold-USD link, and gold itself. The white metal and its miners appear to be in a similar position as well, and the implications are particularly bearish for the miners. After their 1996 top, they erased more than 2/3rds of their prices.
- Many investors got excited by the gold-is-soaring theme in the last few months, but looking beyond the short-term moves, reveals that most of the precious metals sector didn’t show substantial strength that would be really visible from the long-term perspective. Gold doesn’t appear to be starting a new bull market here, but rather to be an exception from the rule.
- Gold’s True Seasonality around the US Labor Day points to a big decline shortly.
Very important, but not as critical factors:
- Long-term technical signs for silver, i.a. the analogy in terms of price to what we saw in 2008, shows that silver could slide even below $10.
- Silver’s very long-term cycles point to a major reversal taking place right now and since the most recent move was up, the implications are bearish (this is also silver’s technical sign, but it’s so important that it deserves its own point)
- Long-term technical signs for gold stocks point to this not being a new gold bull market beginning. Among others, it’s their long-term underperformance relative to gold that hint this is rather a corrective upswing within a bear market that is not over yet.
- Record-breaking weekly volume in gold is a strong sign pointing to lower gold prices
Important factors:
- Extreme volume reading in the SIL ETF (proxy for silver stocks) is an effective indication that lower values of silver miners are to be expected
- Silver’s short-term outperformance of gold, and gold stocks’ short-term underperformance of gold both confirm that the precious metals sector is topping here
- Gold topped almost right at its cyclical turning point, which makes the trend reversal more likely
- Copper broke below its head-and-shoulders pattern and confirmed the breakdown. The last time we saw something similar was in April 2013, when the entire precious metals sector was on the verge of plunging lower.
Moreover, please note that while there may be a recession threat, it doesn’t mean that gold has to rally immediately. Both: recession and gold’s multi-year rally could be many months away – comparing what happened to bond yields in the 90s confirms that.
Copper moved above the neck level of its head-and-shoulders pattern that’s based on the intraday lows, but it didn’t invalidate the analogous level based on the weekly closing prices, so we don’t think it’s justified to say that this bearish formation was invalidated at this time.
Summary
Summing up, the big decline in the precious metals sector appears to be finally underway as gold and silver are plunging even without a rallying USD Index. And the PMs’ decline started right after the U.S. Labor Day, as we have described. Once the USDX takes off, it will likely serve as fuel to the fire-like decline that’s already underway. The similarity to mid-90s continues to support much lower gold prices in the following months. All in all, it seems that what we see right now is the beginning of the final stage of the prolonged decline in the precious metals sector that started in 2011. On a short-term basis, it seems that we might get some temporary strength once gold moves to about $1,330 – perhaps within the next few weeks.
Want free follow-ups to the above article and details not available to 99%+ investors? Sign up to our free newsletter today!
Want free follow-ups to the above article and details not available to 99%+ investors? Sign up to our free newsletter today!
Author

Przemyslaw Radomski, CFA
Sunshine Profits
Przemyslaw Radomski, CFA (PR) is a precious metals investor and analyst who takes advantage of the emotionality on the markets, and invites you to do the same. His company, Sunshine Profits, publishes analytical software that any


