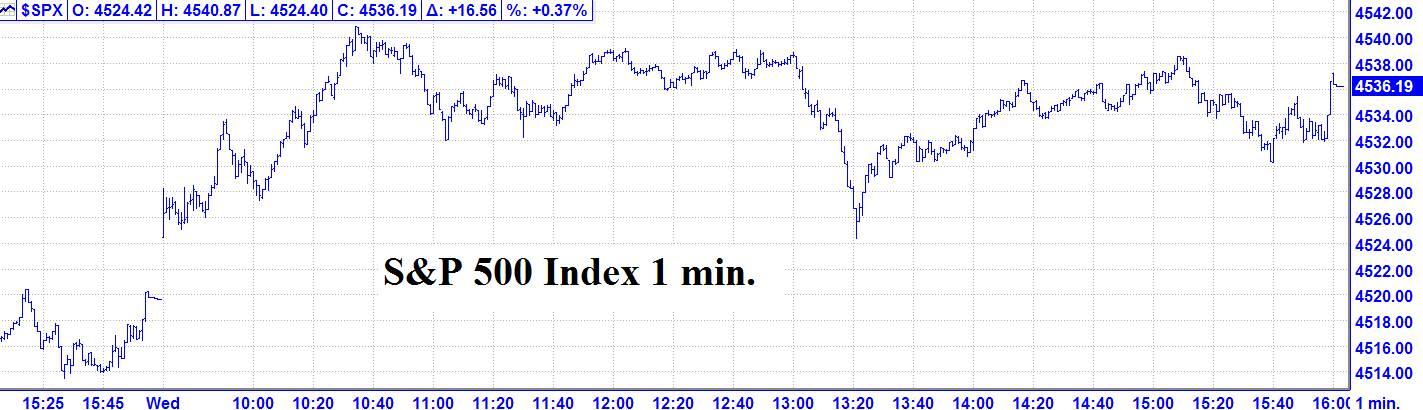
Results and update: The rally may resume into the weekend

10/20 Recap: - The S&P opened with an 4 handle gap up and continued 17 handles higher into a 10:35 AM high of the day, about 23 minutes ahead of the Full Moon. From that high, the S&P pulled back 7 handles into an 11:05 AM low. From that low, the traded into a very narrow 5 handle range, culminating with a high at 1:00 PM. From that high, the S&P declined 12 handles into a 1:21 PM low. From that low, the S&P rallied 15 handles into a 3:08 PM high. From that high, the S&P declined 9 handles into a 3:39 PM low. From that low, the S&P rallied 7 handles into the close.
10//20 – The DJIA and the S&P had a moderate up day and the Nasdaq closed lower with following closes:
The DJIA + 152.03; S&P 500 + 16.56; and the Nasdaq Composite - 7.41. The DJIA made a new all-time high at 35,669.69.
Looking ahead – Wednesday, the market made It’s high of the day about 35 minutes ahead of the exact 10:58 AM Full Moon.
At a minimum, there should be a short term correction. If it doesn’t get rolling on the downside by mid-day Thursday, the rally may resume into the weekend.
The NOW Index is in the NEUTRAL ZONE.
Coming events
(Stocks potentially respond to all events).
4. A. 10/22 AC – Mercury Greatest Elongation West. Major change in trend Corn, Oats, Soybeans, Wheat.
B. 10/22 AC – Jupiter 150 US Neptune. Moderate change in trend US Stocks, T-Bonds, US Dollar, & Oil.
C. 10/22 AC – Uranus 90 US MC. Major change in trend US Stocks, T-Bonds, US Dollar.
Stock market key dates
Fibonacci – 10/29.
Astro – 10/25, 10/29 AC.
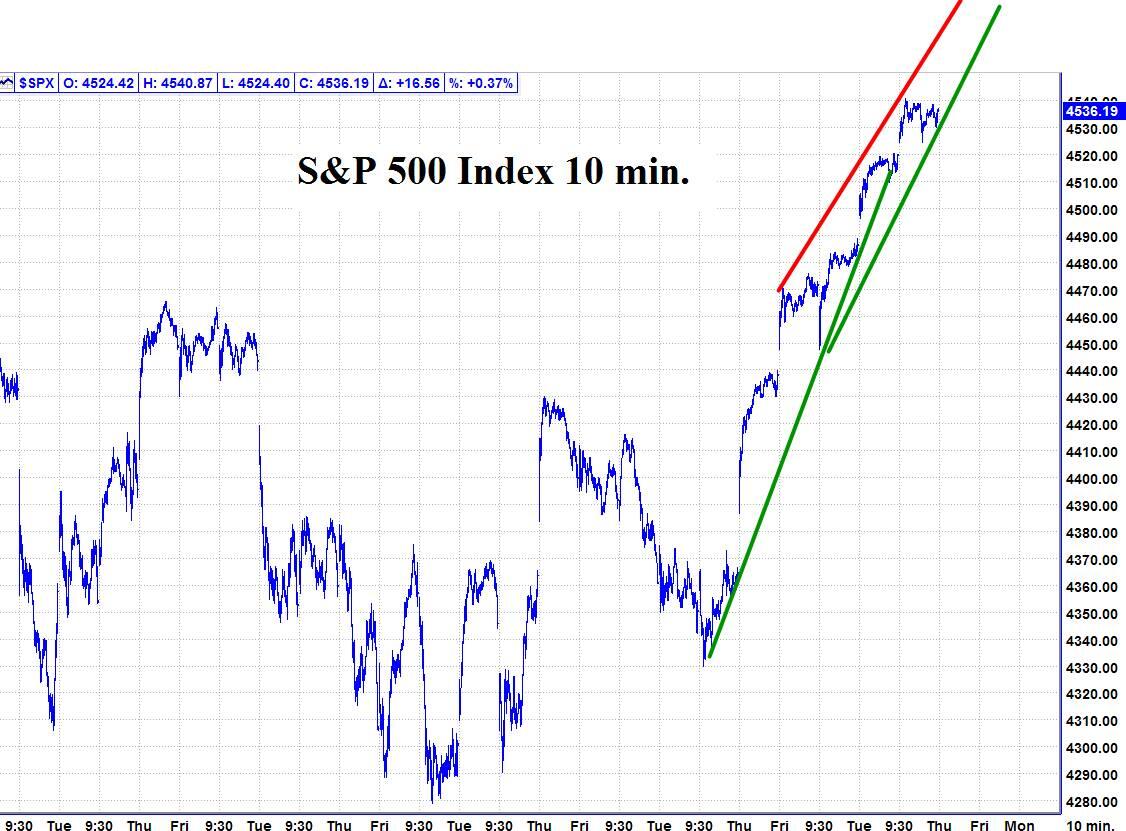
Please see below the S&P 500 10 minute chart.
Support - 4510, 4420, Resistance – 4545.
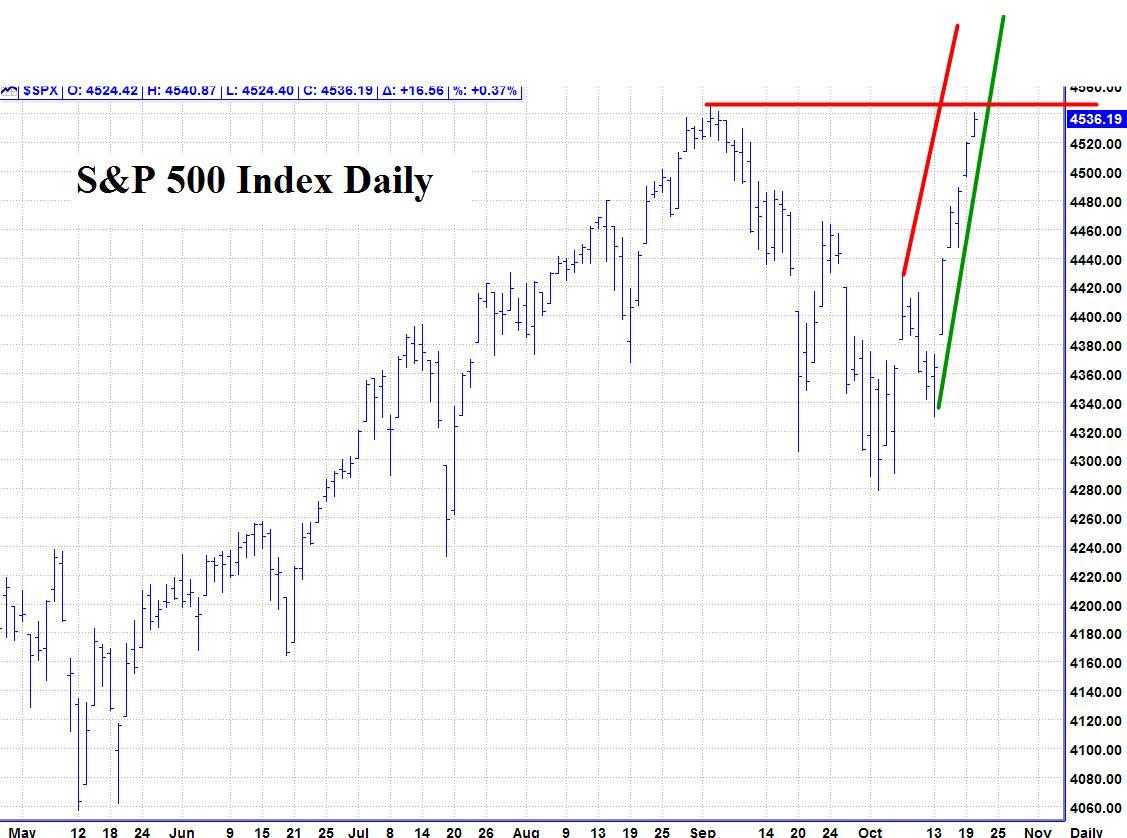
Please see below the S&P 500 Daily chart.
Support - 4510, 4420, Resistance – 4545.
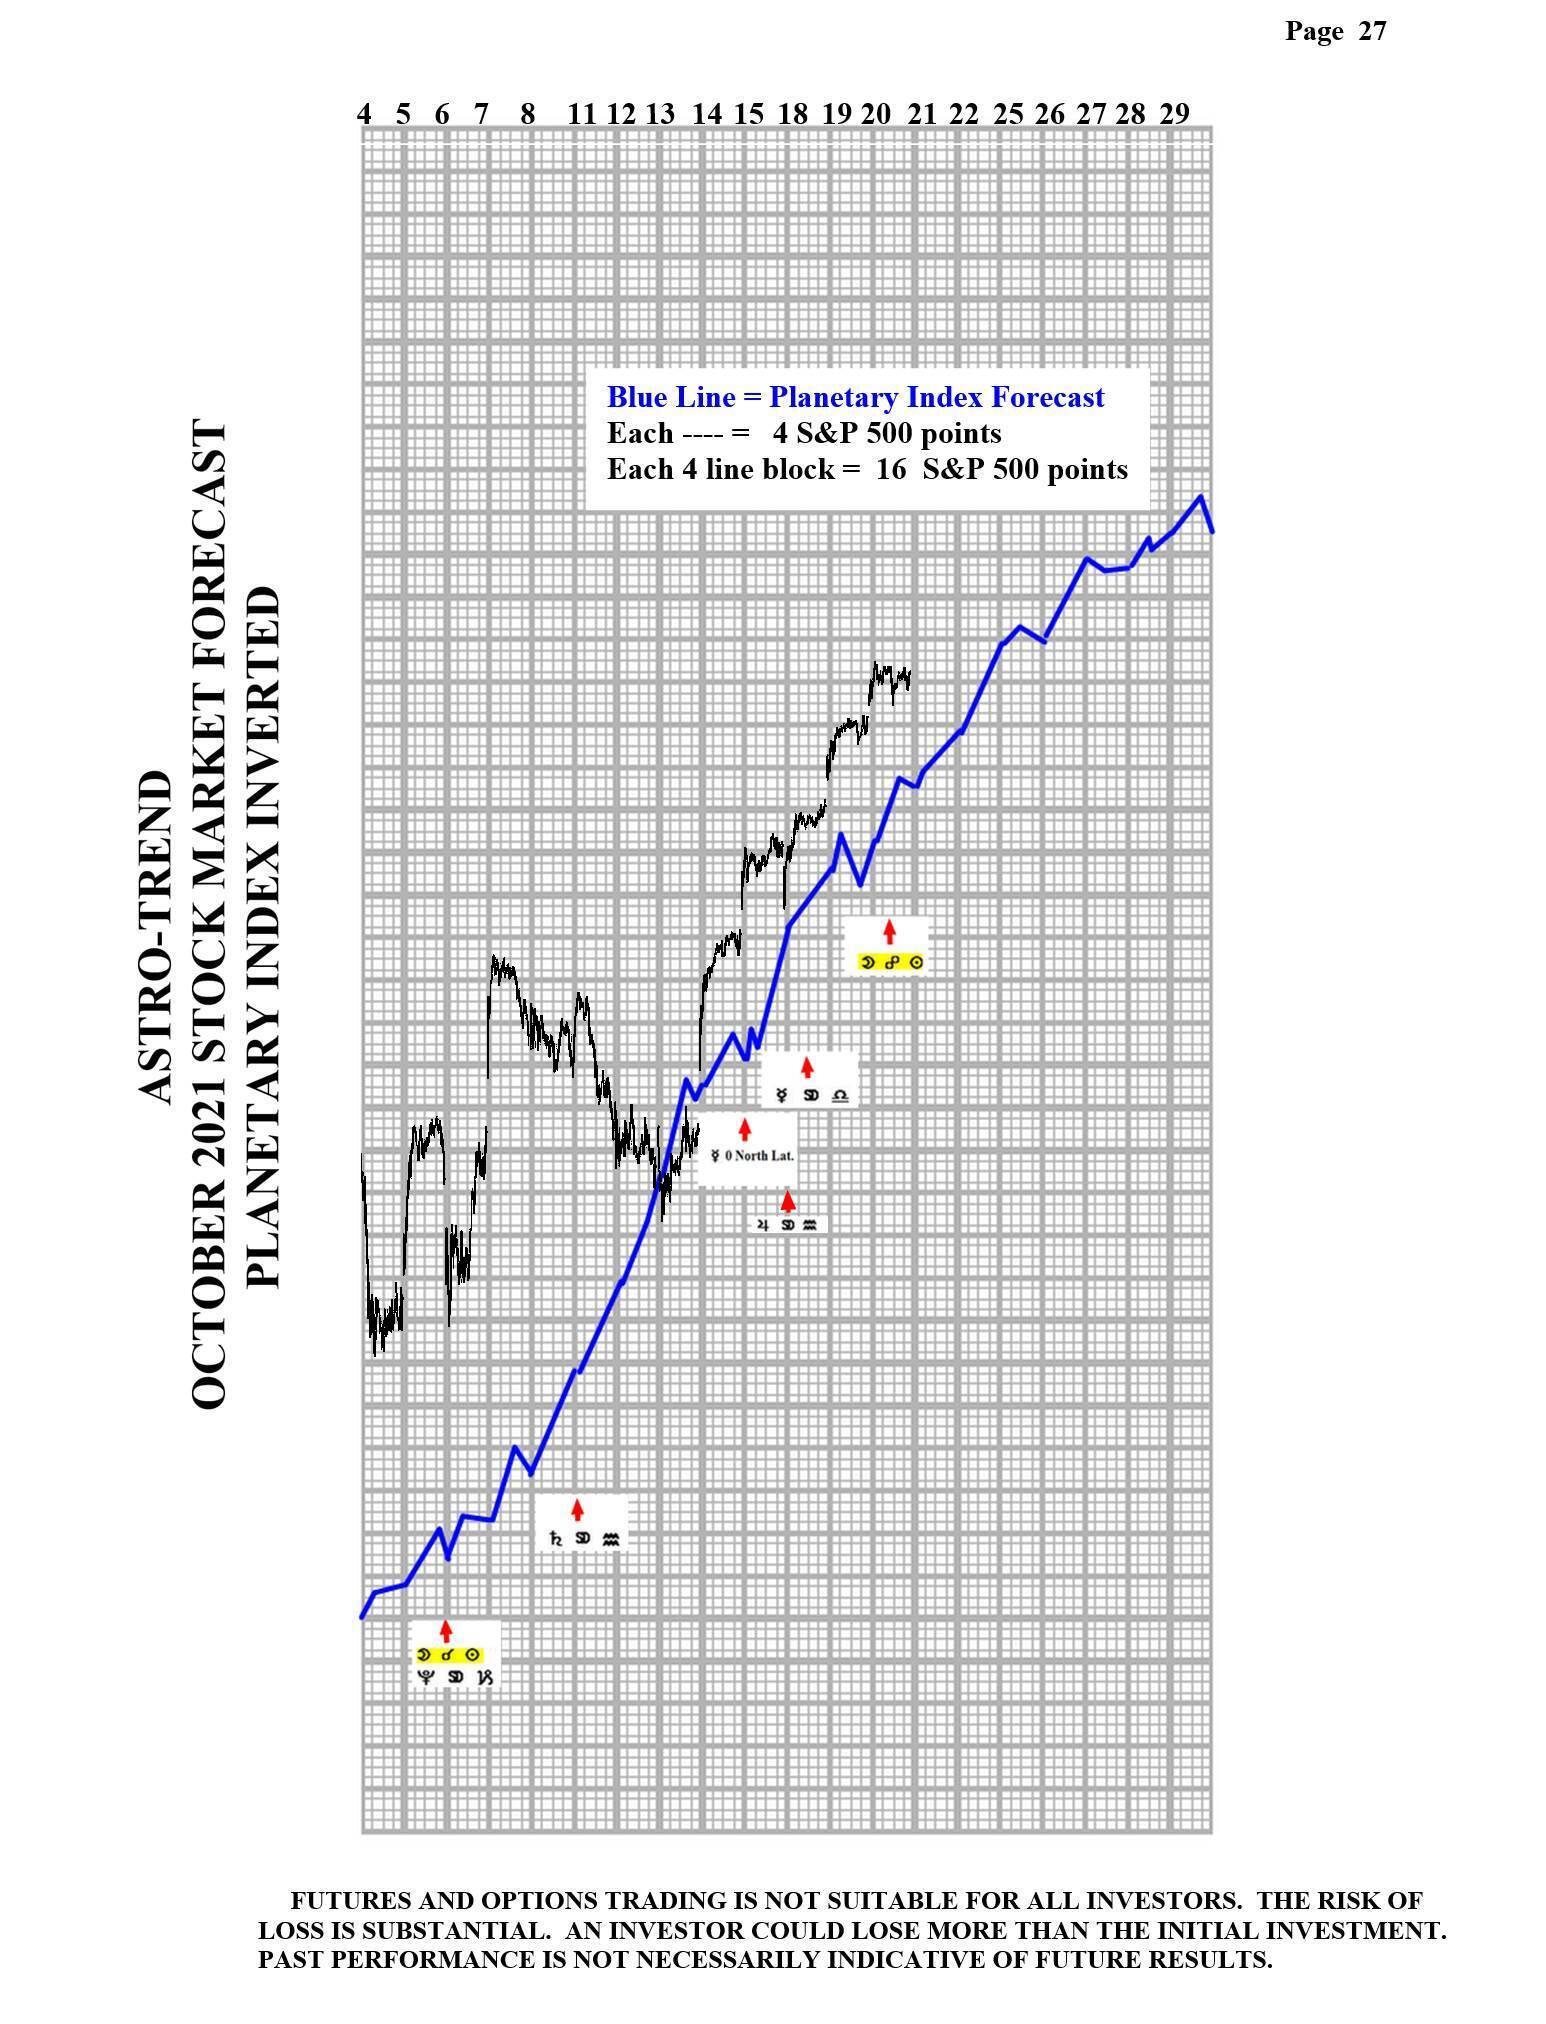
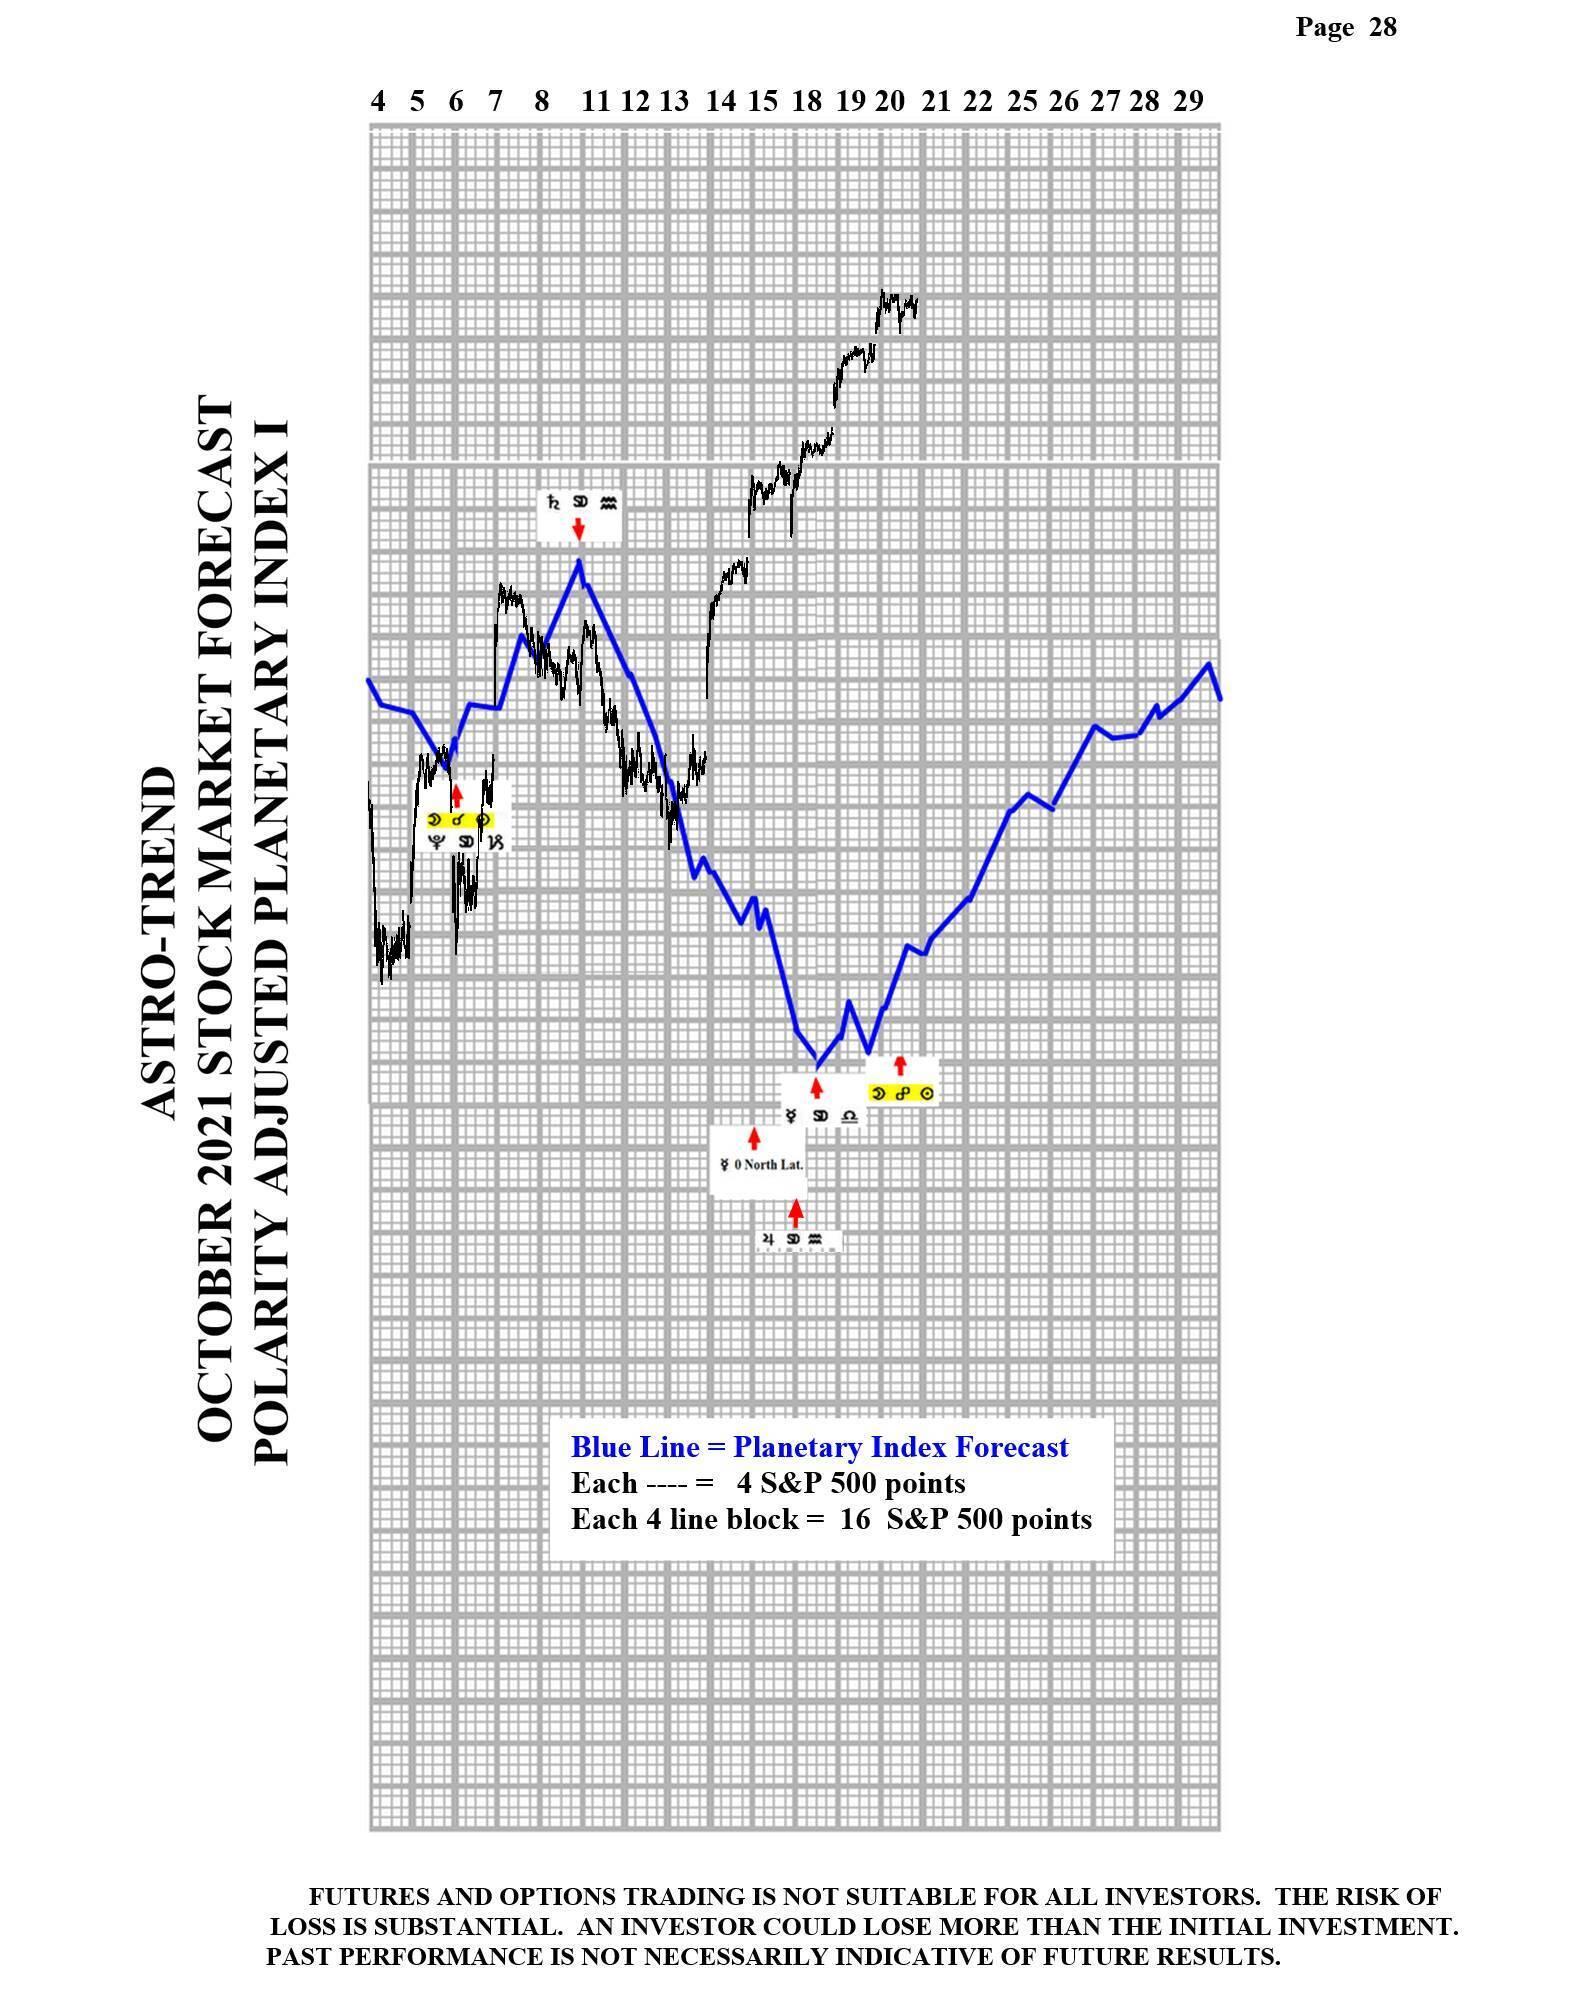
Please see below the Planetary Index charts with S&P 500 10 minute bars for results.


Author

Norm Winski
Independent Analyst
www.astro-trend.com


