Last week, China and the U.S. have agreed to resume face-to-face talk in Washington in early October. It's however still unclear if both sides can make substantial, even if temporary, agreement to solve their disputes. Nonetheless, the news is a welcome relief to the market with the year-long conflict dampening 2020 growth forecasts. Prior to this progress, there's a mounting fear that trade wars and other factors such as Brexit can push the global economy into recession.

The trade war escalated last month with the U.S and China both increasing the tariff. By December, almost all of China's export worth $520 billion will incur a tariff of around 22% on average. Meanwhile, U.S. exports to China will incur an average tariff of 20%. The recent U.S. data has started to show the economic deterioration. For example, the recent ISM purchasing manager index (PMI) fell below 50, signalling a contraction.

Precious metal traders took the opportunity of the good news by taking profit in Gold and Silver. The precious metals have been on a tear this year even after the recent pullback. A combination of factors including slowing economy, geopolitical tension, and negative yielding bonds drive the speculative demand of precious metals up. Below is a Year-to-Date (YTD) Return on different asset categories as of September 9, 2019

YTD Return
S&P 500 20.26%
DAX 16.30%
Nikkei 7.08%
Gold 17.70%
Silver 16.74%
10 Year Notes 8.10%
Dollar Index 2.37%

All asset classes is doing well at the time of this writing. Gold and Silver are among the top performers this year even after the recent pullback. Trade war however is not the only driver for Gold and Silver in the long run. Arguably, trade war is not the major driver although it can certainly contribute to the recent rally. In our view, the major driver for the rally in Gold and Silver is the $17 trillion worth of negative yielding bonds.

Negative yielding bonds are recent phenomenon happening only in the past few years after the unprecedented money printing by the central banks. Bonds used to be a risk-free asset category which will perform well when stock market drops. As owning Gold doesn't give dividends or interest, many investors argue that investing money in banks or bonds is a better alternative to reduce risk as they can get yields. However, with banks around the world offering near zero interest rate and negative yielding bonds, holding Gold now becomes much more attractive.

Bond market is also currently arguably in a bubble territory with yields going negative. We have never faced this situation where the risk-free asset category is actually in a bubble. When it finally reverses, then there's a lack of suitable risk-free asset alternative. Physical Gold can fill this role perfectly as an alternative risk-free asset.

Gold Long Term Elliott Wave Outlook

XAU

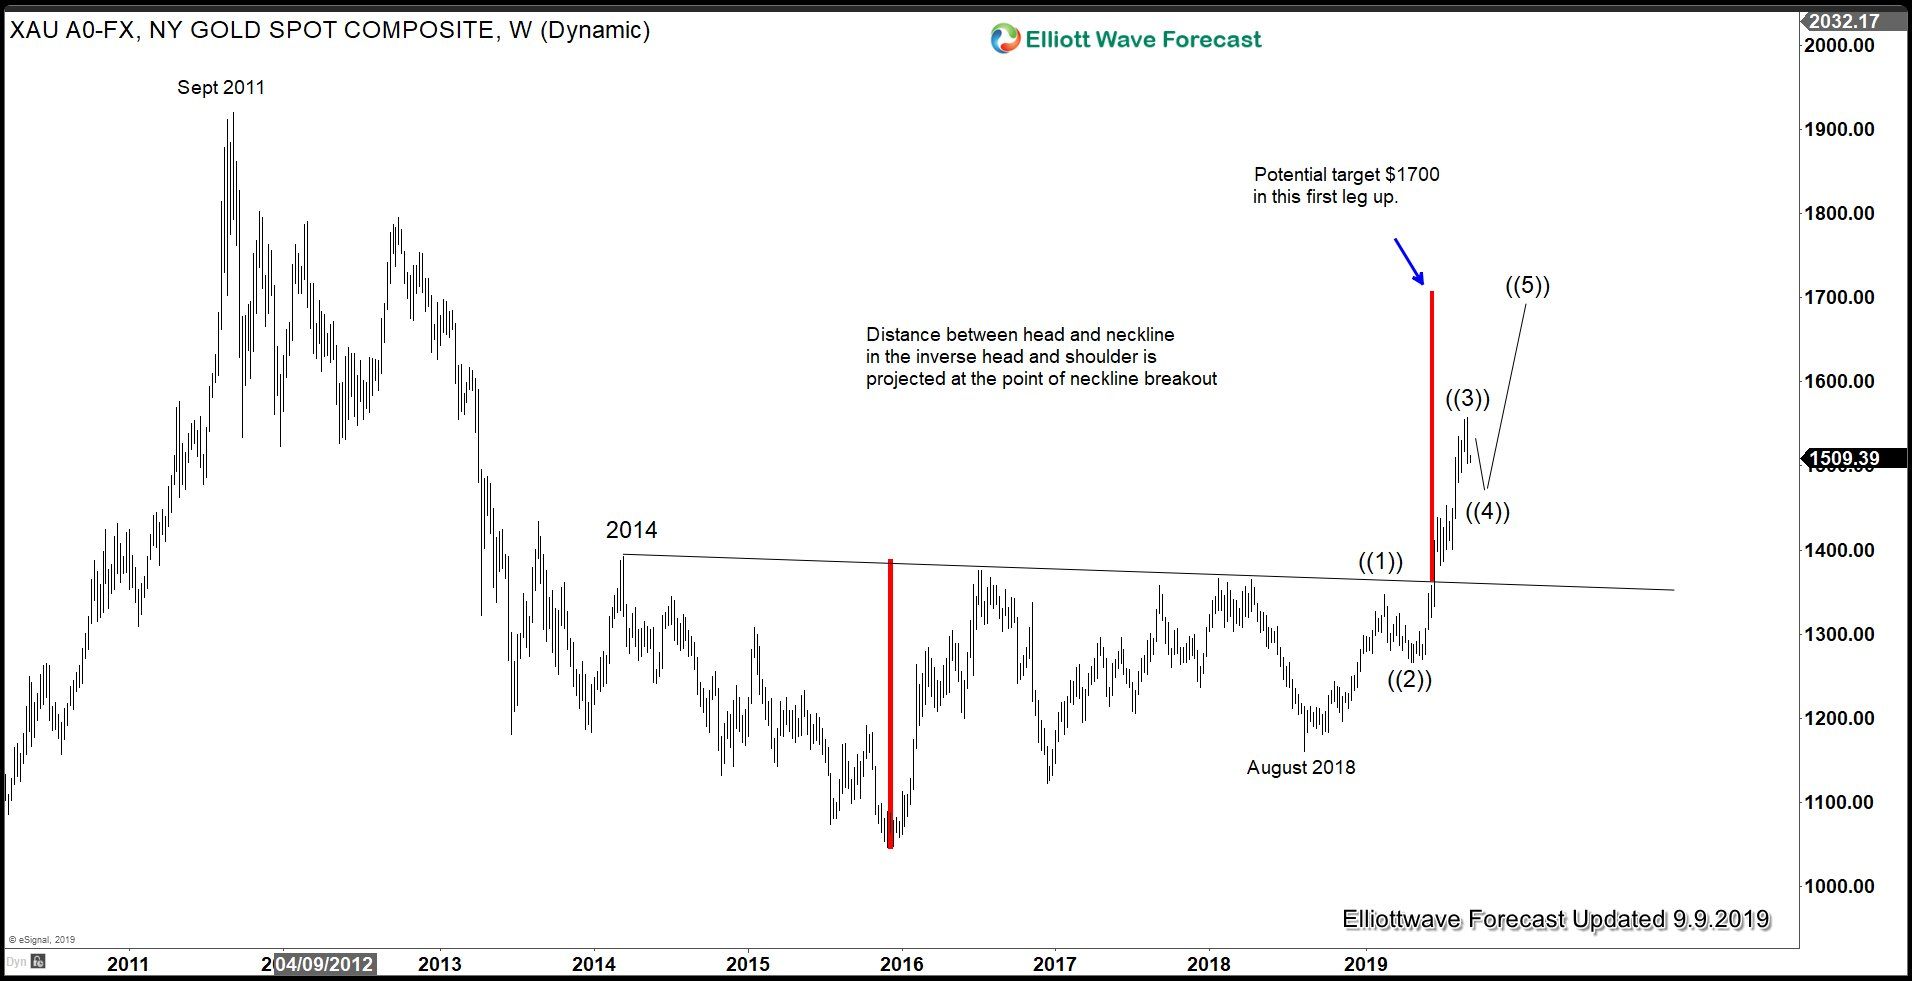
Since breaking above the neckline of the inverse head and shoulders from 2014, Gold has continued to rally sharply. An orthodox target for the move up is calculated by measuring the head of the inverse head and shoulder to the neckline. Then the distance is projected from the point of the breakout of the neckline to get an orthodox target of $1700. The rally from August 2018 low is unfolding as a 5 waves impulse Elliott Wave structure, and the recent pullback is a temporary setback in wave ((4)). Once this pullback is over, the yellow metal should resume higher again.

Gold Elliott Wave Path

XAU

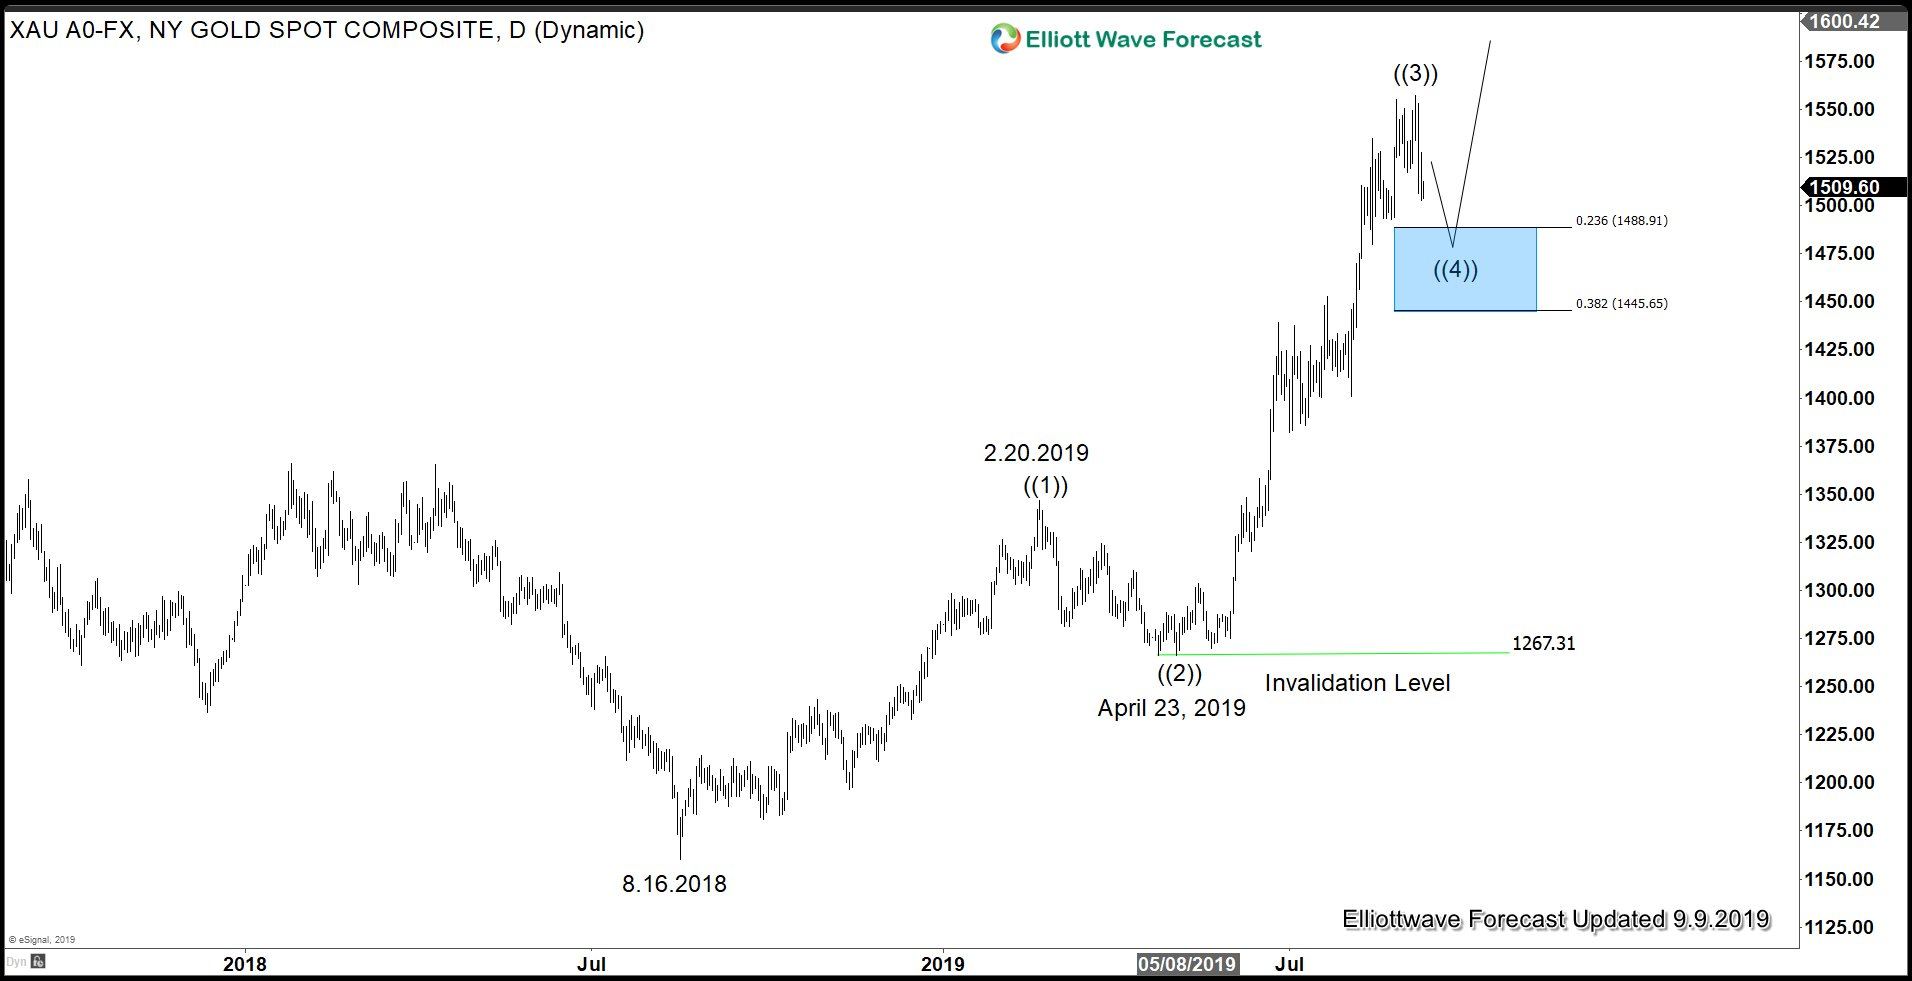
If the current pullback is a wave ((4)), then typically it can end around 23.6 – 38.2% Fibonacci retracement of wave ((3)) which should come at $1445 – $1489. From here, the yellow metal can resume higher again or bounce in 3 waves at least. Please note that we can't rule out a few weeks / months consolidation in wave ((4)) as wave ((2)) took 2 months to form.

Gold-to-Silver Ratio (GSR) has ended cycle from 2011 low

AUG

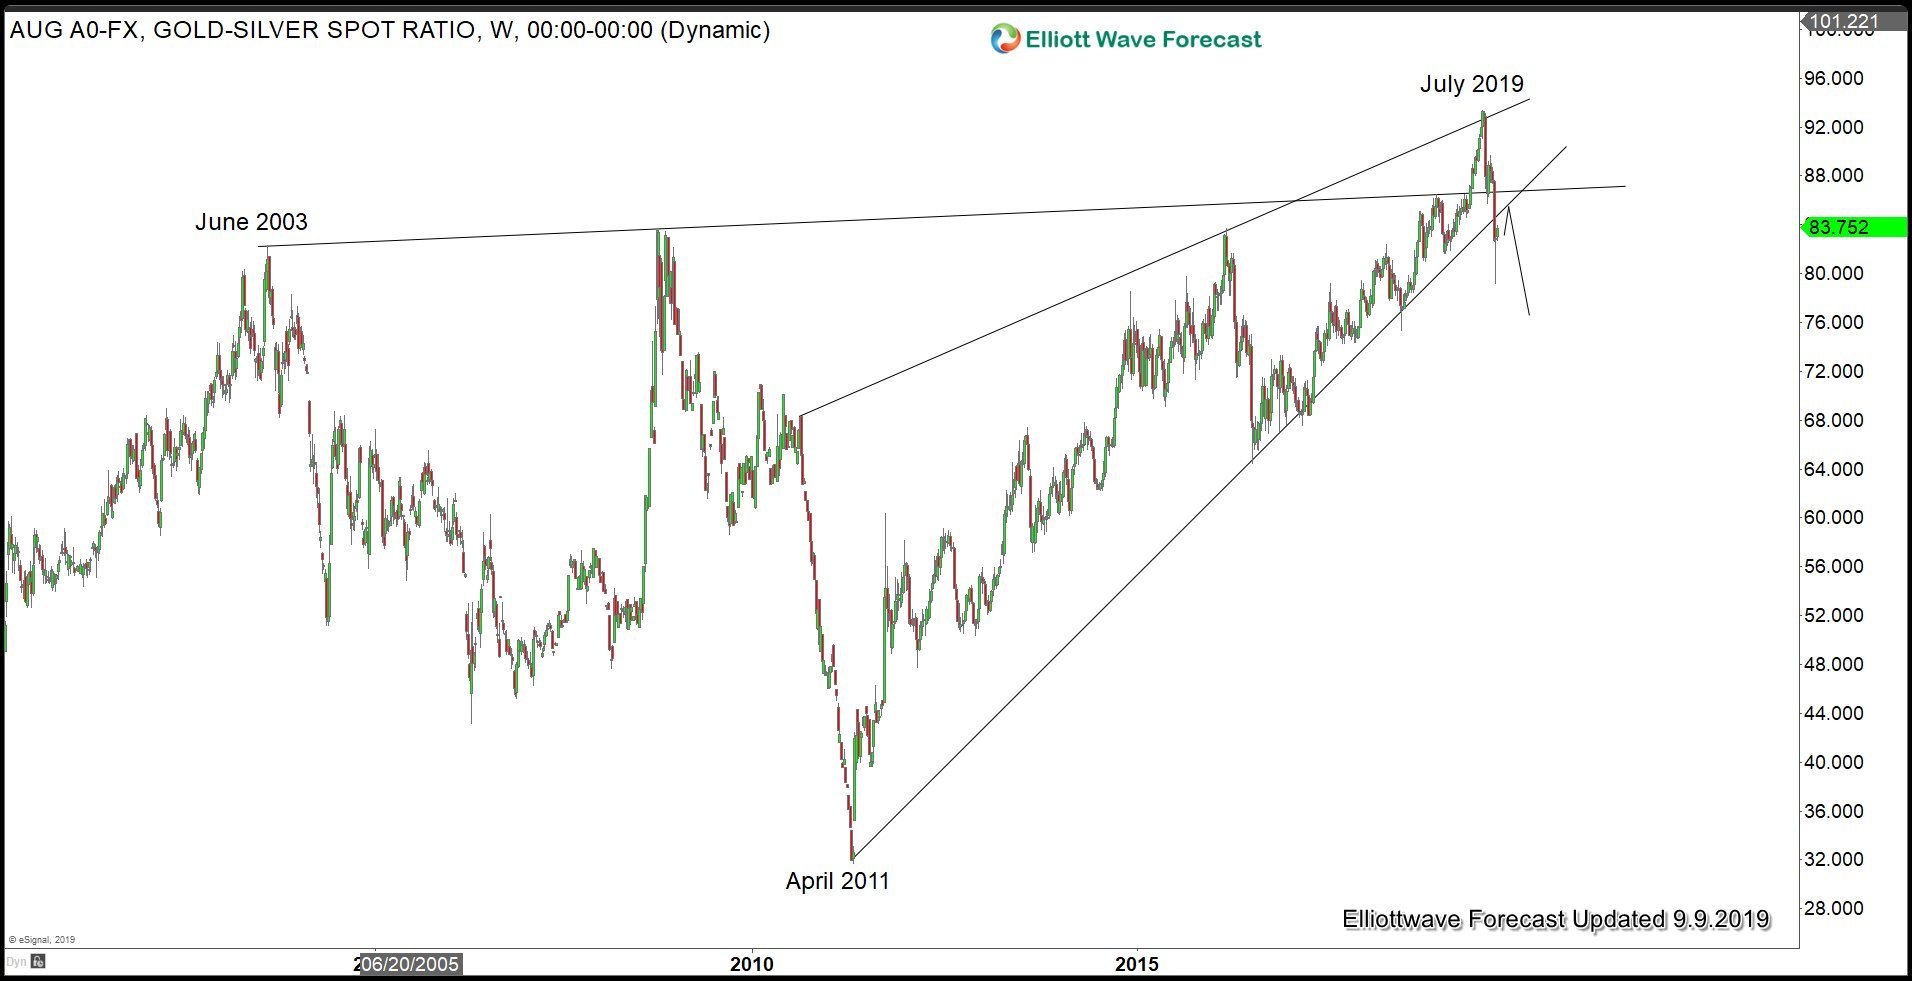
Gold-to-Silver Ratio (GSR) trades inversely with the underlying precious metals (Gold and Silver). When the ratio rises, the price of the underlying metals go down and vice versa. In the above chart, it has decisively broken and closed below April 2011 low trend line and thus the cycle is already over. Now GSR may retest the broken trend line, but it should get rejection and the GSR should continue to extend lower again, further supporting the precious metals.

FURTHER DISCLOSURES AND DISCLAIMER CONCERNING RISK, RESPONSIBILITY AND LIABILITY Trading in the Foreign Exchange market is a challenging opportunity where above average returns are available for educated and experienced investors who are willing to take above average risk. However, before deciding to participate in Foreign Exchange (FX) trading, you should carefully consider your investment objectives, level of xperience and risk appetite. Do not invest or trade capital you cannot afford to lose. EME PROCESSING AND CONSULTING, LLC, THEIR REPRESENTATIVES, AND ANYONE WORKING FOR OR WITHIN WWW.ELLIOTTWAVE- FORECAST.COM is not responsible for any loss from any form of distributed advice, signal, analysis, or content. Again, we fully DISCLOSE to the Subscriber base that the Service as a whole, the individual Parties, Representatives, or owners shall not be liable to any and all Subscribers for any losses or damages as a result of any action taken by the Subscriber from any trade idea or signal posted on the website(s) distributed through any form of social-media, email, the website, and/or any other electronic, written, verbal, or future form of communication . All analysis, trading signals, trading recommendations, all charts, communicated interpretations of the wave counts, and all content from any media form produced by www.Elliottwave-forecast.com and/or the Representatives are solely the opinions and best efforts of the respective author(s). In general Forex instruments are highly leveraged, and traders can lose some or all of their initial margin funds. All content provided by www.Elliottwave-forecast.com is expressed in good faith and is intended to help Subscribers succeed in the marketplace, but it is never guaranteed. There is no “holy grail” to trading or forecasting the market and we are wrong sometimes like everyone else. Please understand and accept the risk involved when making any trading and/or investment decision. UNDERSTAND that all the content we provide is protected through copyright of EME PROCESSING AND CONSULTING, LLC. It is illegal to disseminate in any form of communication any part or all of our proprietary information without specific authorization. UNDERSTAND that you also agree to not allow persons that are not PAID SUBSCRIBERS to view any of the content not released publicly. IF YOU ARE FOUND TO BE IN VIOLATION OF THESE RESTRICTIONS you or your firm (as the Subscriber) will be charged fully with no discount for one year subscription to our Premium Plus Plan at $1,799.88 for EACH person or firm who received any of our content illegally through the respected intermediary’s (Subscriber in violation of terms) channel(s) of communication.

Recommended Content


Recommended Content

Editors’ Picks

EUR/USD retreats toward 1.0650 after PMI-inspired rebound

EUR/USD retreats toward 1.0650 after PMI-inspired rebound

EUR/USD loses traction and retreats to the 1.0650 area after rising toward 1.0700 with the immediate reaction to the upbeat PMI reports from the Eurozone and Germany. The cautious market stance helps the USD hold its ground ahead of US PMI data.

EUR/USD News

GBP/USD fluctuates near 1.2350 after UK PMIs

GBP/USD fluctuates near 1.2350 after UK PMIs

GBP/USD clings to small daily gains near 1.2350 in the European session on Tuesday. The data from the UK showed that the private sector continued to grow at an accelerating pace in April, helping Pound Sterling stay resilient against its rivals.

GBP/USD News

Gold flirts with $2,300 amid receding safe-haven demand

Gold flirts with $2,300 amid receding safe-haven demand

Gold (XAU/USD) remains under heavy selling pressure for the second straight day on Tuesday and languishes near its lowest level in over two weeks, around the $2,300 mark in the European session. Eyes on US PMI data. 

Gold News

Here’s why Ondo price hit new ATH amid bearish market outlook Premium

Here’s why Ondo price hit new ATH amid bearish market outlook

Ondo price shows no signs of slowing down after setting up an all-time high (ATH) at $1.05 on March 31. This development is likely to be followed by a correction and ATH but not necessarily in that order.

Read more

US S&P Global PMIs Preview: Economic expansion set to keep momentum in April

US S&P Global PMIs Preview: Economic expansion set to keep momentum in April

S&P Global Manufacturing PMI and Services PMI are both expected to come in at 52 in April’s flash estimate, highlighting an ongoing expansion in the private sector’s economic activity.

Read more

Majors

Cryptocurrencies

Signatures