Platinum's struggles exacerbated by dollar's strengthening

The market for precious metals experienced some difficulties last week after the greenback started recuperating once again. The EUR/USD temporarily broke out above the psychological barrier of 1.20000 last Tuesday before the pair rebounded. The dollar started recovering after the publication of robust manufacturing numbers for August, which entail faster-than-expected recovery in the US.
Given the snap rebound of the EUR/USD and the better prospects for a dollar recovery, the commodity market is likely to register a spillover effect from these recent developments. Chiefly, an advancing dollar could impede the unprecedented bullish rally of gold, which, in turn, would have an adverse impact on other precious metals such as platinum.
The latter broke down below the psychologically significant level of $1000 per troy ounce in early-August, which signals solid bearish sentiment in the market. Given this pre-existing bearish sentiment and the recent developments, the price of platinum is likely to continue sliding in the near term.
1. Long-Term Outlook:
As can be seen on the daily chart below, Platinum's October futures contract is currently consolidating just below the 23.6 per cent Fibonacci retracement level at 924.8. Previously, the bullish trend was exhausted when the price action failed to break out above the major resistance level at 1040.0.
Notice that this uptrend formed a massive bullish flag pattern, and the currently evolving downtrend is in the process of establishing a bearish flag pattern. Hence, this can be interpreted as a substantial bearish signal.
The massive bullish engulfing candle that broke down below the 23.6 per cent Fibonacci retracement level also drove the price action below the bearish flag pattern's lower boundary. This manifests a recent indication of the currently rising bearish bias in the market.
Immediately following this breakdown, the price action started forming the aforementioned consolidation. Once it is ready to continue with its directional trading, the price action is likely to resume falling towards the next major target – the 38.2 per cent Fibonacci retracement at 855.5.
It is also worthwhile mentioning that the current minor consolidation just below the 23.6 per cent Fibonacci represents a normal break in the development of a broader downswing. That is so because the price action had rebounded from this level on several occasions in the past, which means that the market would need some time to recuperate after the decisive breakdown that occurred just several days ago.

The ADX indicator has been threading below the 25-point benchmark since the 12th of August, which confirms that the preceding bullish trend is now officially terminated. In other words, the market is indeed ready to change directions and continue heading lower.
The Stochastic RSI indicator, in contrast, illustrates two crucially important developments. Firstly, the market became 'Oversold' roughly the same time it also started range-trading. This could prompt the establishment of a minor bullish correction if the bulls seize the opportunity. Secondly, the bearish crossover from the 2nd of September means that the bears are not quite ready to stop adding to their short orders at the current moment. Consequently, the underlying selling pressure remains quite robust, even as the market became extremely 'oversold'.
2. Short-Term Outlook:
The most significant indication of the increasingly bearish outlook of platinum can be observed on the 4H chart below. The price action recently concluded establishing a Head and Shoulders pattern (H&S), which typically is perceived as a bullish reversal pattern as it is usually found at the end of a recent uptrend. In this case, the H&S was established just around the psychologically important level at 1000.0 and below the major resistance level at 1040.0, which represents quite a substantial indication of rising bearish bias.
After the pattern was finished, the price action established a false breakdown below the neckline at 937.0 and the 23.6 per cent Fibonacci, but then it went on to develop the aforementioned bearish flag. The latter was concluded with the emergence of a 'Shooting Star' candle at the swing high, which entails high bearish sentiment.
Immediately afterwards, the price action established the aforementioned breakdown, which drove the price below the 23.6 per cent Fibonacci.
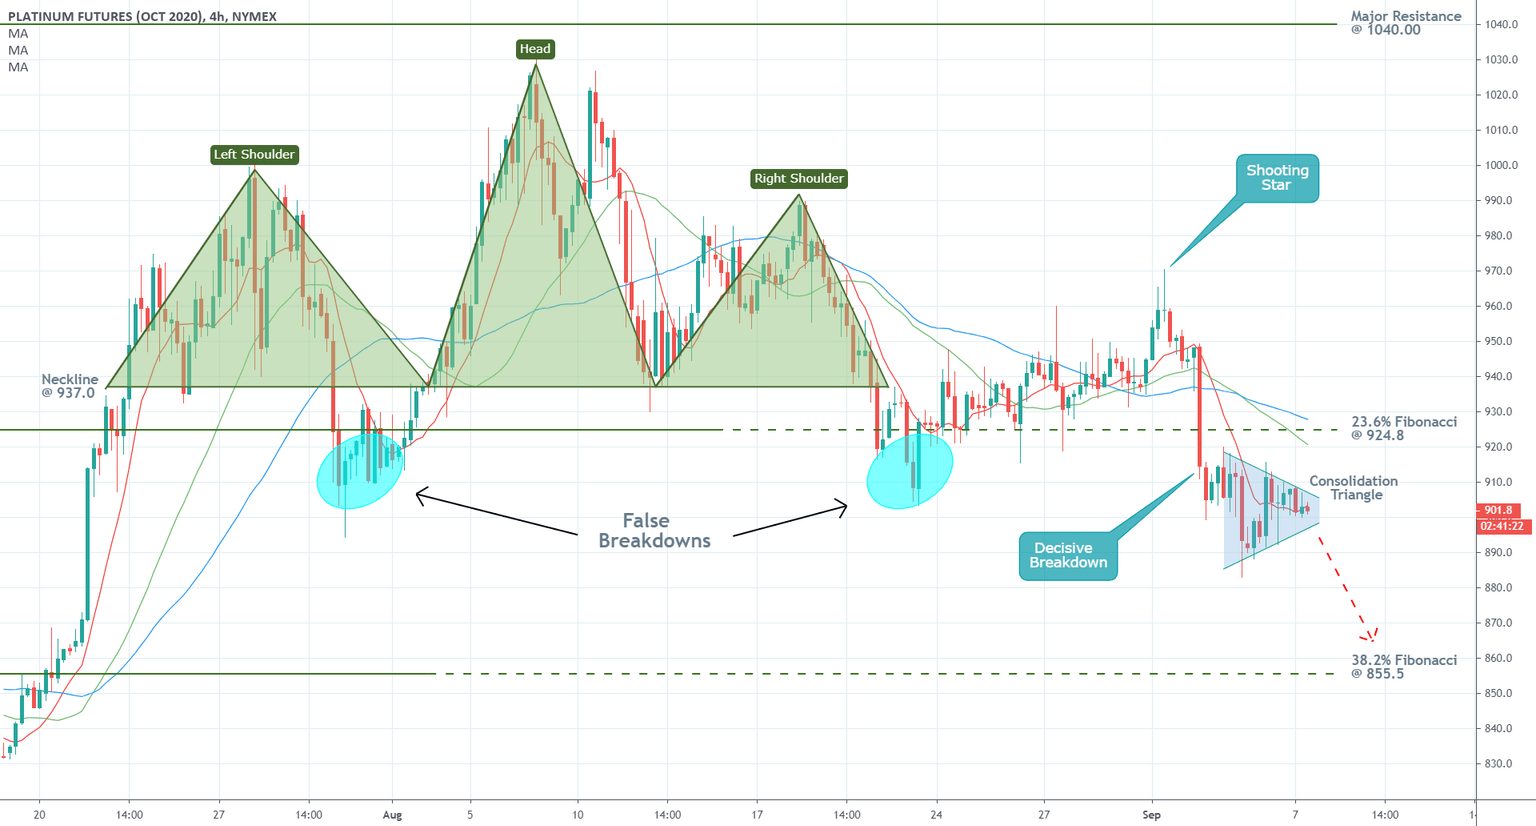
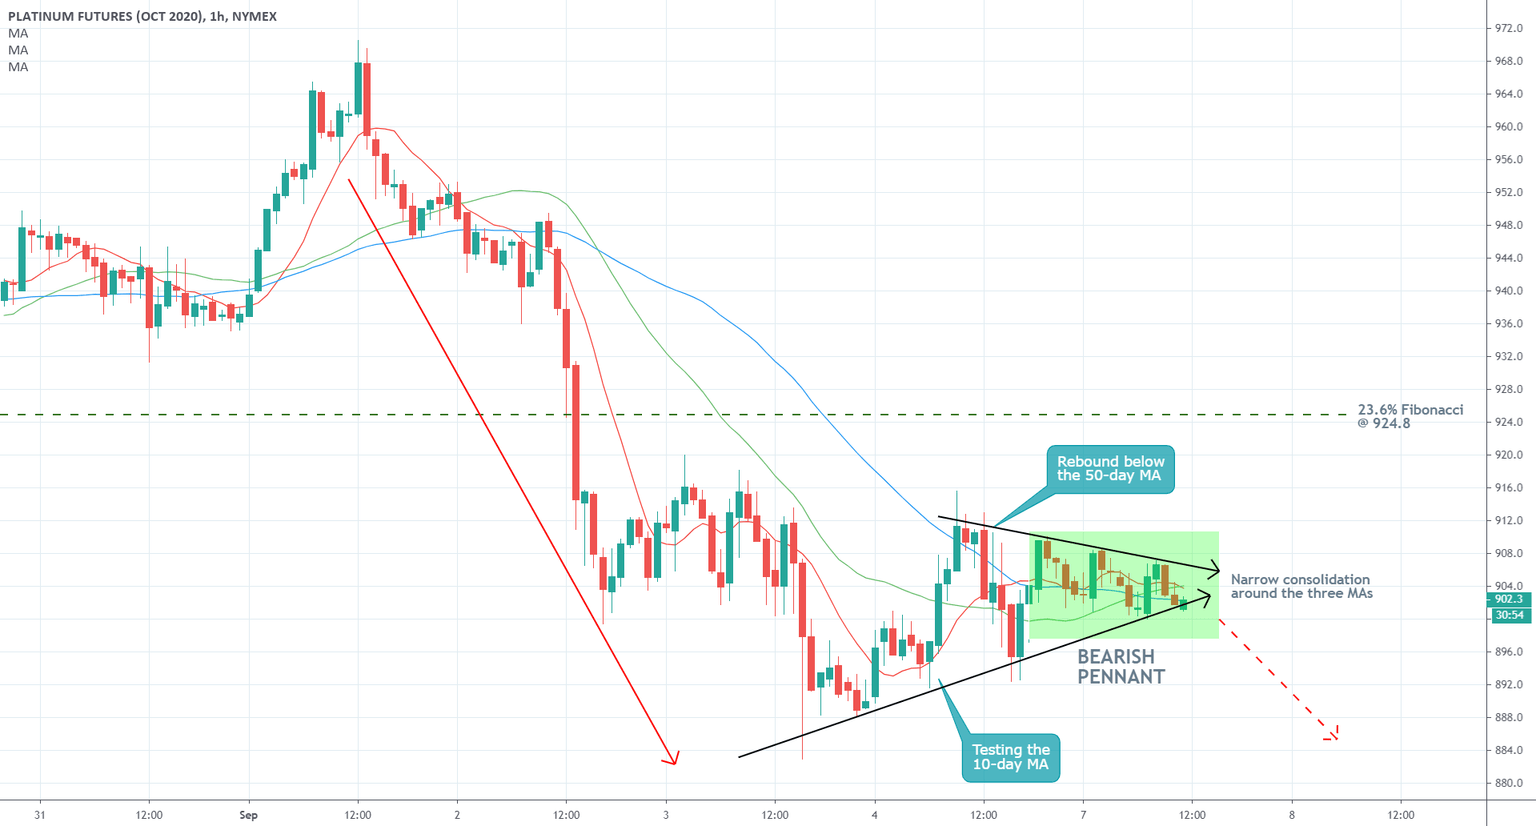
Notice that the price action is currently consolidating within the boundaries of a triangle – a bearish trend continuation pattern. While this is taking place around the 10-day MA (in red), the latter remains concentrated below the 30-day MA (in green) and the 50-day MA (in blue). This descending order is also inlined with the primary expectations for the continuation of the current downswing's development.
The triangle pattern resembles a rising pennant on the hourly chart below, which is also an inherently bearish formation. The price action has already rebounded from the three MAs on several occasions as it continues to consolidate within an increasingly narrower range. This behaviour entails falling volatility as the market gets ready to continue with its directional trading in the very near future.
3. Concluding Remarks:
The underlying fundamentals seem to suggest that the commodities market is currently undergoing through a dramatic change as the greenback continues to recoup from its recent plunge. The spillover effect from this is exerting pressure on platinum's October futures contract.
The examined technicals also seem to confirm these assertions, given that the price action is looking increasingly more bearish. At present, the price action is consolidating following a major breakdown, but once this process is concluded, platinum would be ready to resume sliding further down south.
Author

Plamen Stoyanov
Trendsharks
Plamen started his career on the global capital markets in 2012 when he began trading with financial derivatives.


