Patterns: EUR/CHF, AUD/CAD, USD/RUB, EUR/RUB

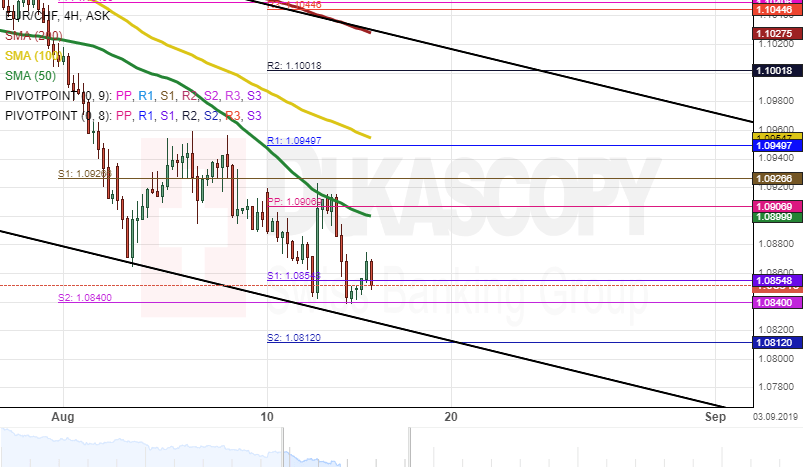
EUR/CHF 4H Chart: Pressured by 50– and 100– hour SMAs
Since July 31, the common European currency has depreciated about 1.89% in value against the Swiss Franc. The currency pair was pressured by the 100– hour simple moving average.
The exchange rate was trading near the bottom border of a descending channel pattern at 1.0854 during the morning hours of Thursday's trading session and could be set for a breakout.
If this breakout occurs, bearish traders could aim at the weekly S3 at 1.0759 during next week's trading sessions.
On the contrary, the weekly S1 and the monthly S2 near the 1.0854 area could provide support for the EUR/CHF currency exchange rate and help push the pair towards the 100– hour SMA at 1.09571 in the short-term.
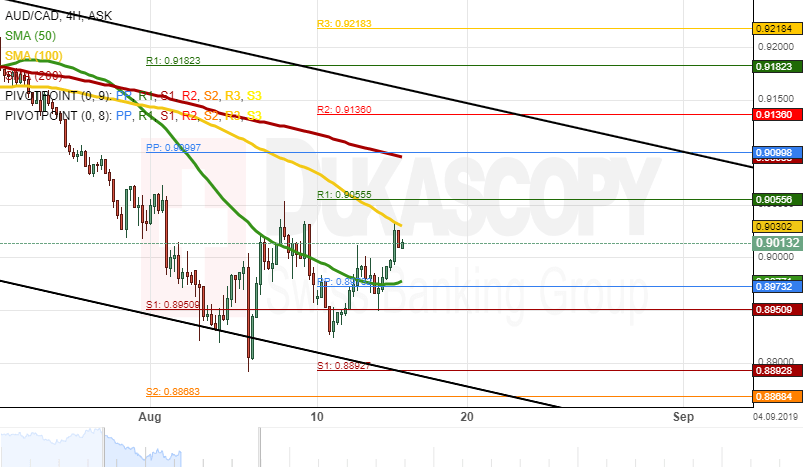
AUD/CAD 4H Chart: Tests 100– hour SMA
During last week trading sessions, the Australian Dollar versus the Canadian Dollar tried to breach the long-term descending channel. As apparent on the 4(H) chart, the currency pair reversed north from its lower boundary at 0.8802.
The exchange rate is currently testing a resistance level formed by the 100– hour simple moving average at 0.9034.
If the resistance level holds, a decline towards a support cluster at 0.8868 could be expected in the short term.
However, if the currency exchange rate passes the 100– hour SMA, bullish traders could aim for the upper line of the descending channel pattern at 0.9150 during next week's trading sessions.
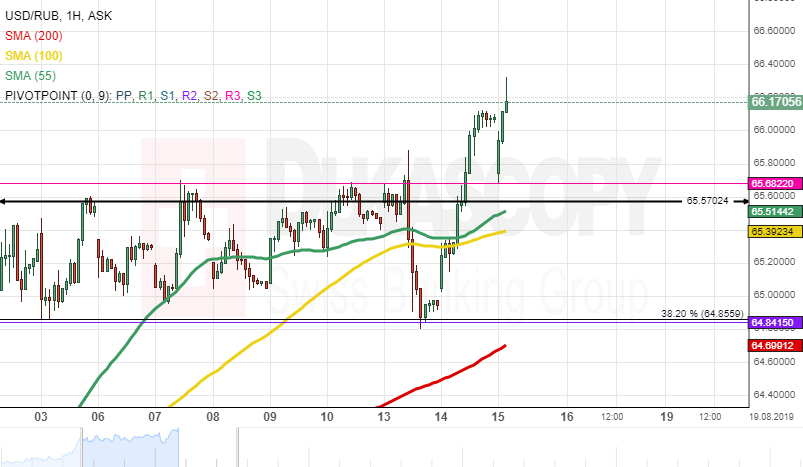
USD/RUB 1H Chart: Upside potential could prevail
The Russian Ruble has been depreciating against the US Dollar since the middle of July when the USD/RUB currency pair reversed north from the psychological level at 62.50.
As apparent on the chart, the exchange rate has already reached the monthly R3 at the 65.68. Given, that the rate is supported by the 55-, 100– and 200-hour moving averages, currently located in the 64.56/65.38 range, it is likely, that some upside potential could prevail in the market. The pair could reach the Fibonacci 23.00% retracement at 67.14.
It is unlikely, that bears could prevail in the market, and the rate could drop lower than the 63.00 mark due to the support of the Fibonacci 50.00% retracement.
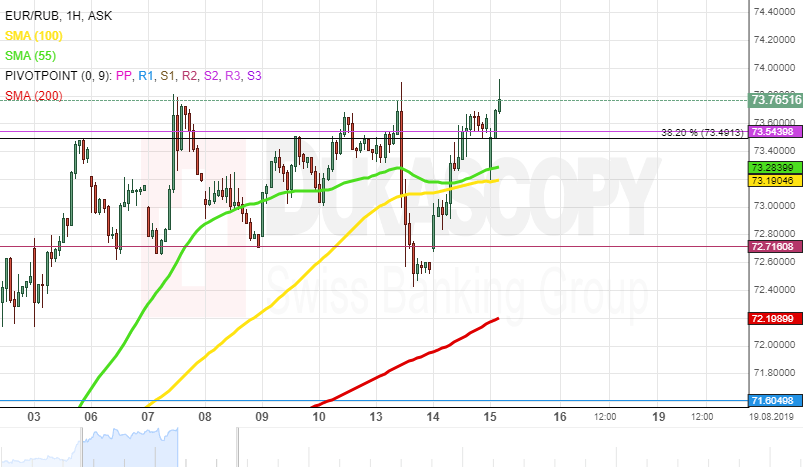
EUR/RUB 1H Chart: Short-term increase expected
The EUR/RUB exchange rate has been trading upwards since the beginning of August after the rate reversed north from the descending trend line at 70.26.
Currently, the currency pair is testing the resistance level formed by a combination of the monthly R3 and the Fibonacci 38.20% retracement at 73.49. Given, that the pair is supported by the 200-hour SMA at 72.06, it is likely, that it could breach the given resistance and continue to go upwards in the nearest future. In this case, the rate could reach the Fibo 23.60% retracement at 76.71 in the medium term.
However, if the given resistance level holds, it is expected, that a reversal south could occur soon. Important support level to look out for is the Fibonacci 50.00% retracement at the 70.89 mark.
Author

Dukascopy Bank Team
Dukascopy Bank SA
Dukascopy Bank stands as an innovative Swiss online banking institution, with its headquarters situated in Geneva, Switzerland.


