Hello fellow traders. In this technical blog we’re going to take a quick look at the charts of Palladium Futures published in members area of the website.  As of right now Palladium is giving us nice reaction from the Weekly Blue Box area. We’re calling August 2018 cycle completed at 1577 peak and now getting deeper pull back. The price is showing incomplete swings sequences in the cycle from the 1577.07 peak suggesting further separation lower . Break of 03/28 low has opened possibility for further extension downside. Consequently the commodity is now targeting 1137.8 area. In further text we’re going to explain the Elliott Wave structure and forecast.

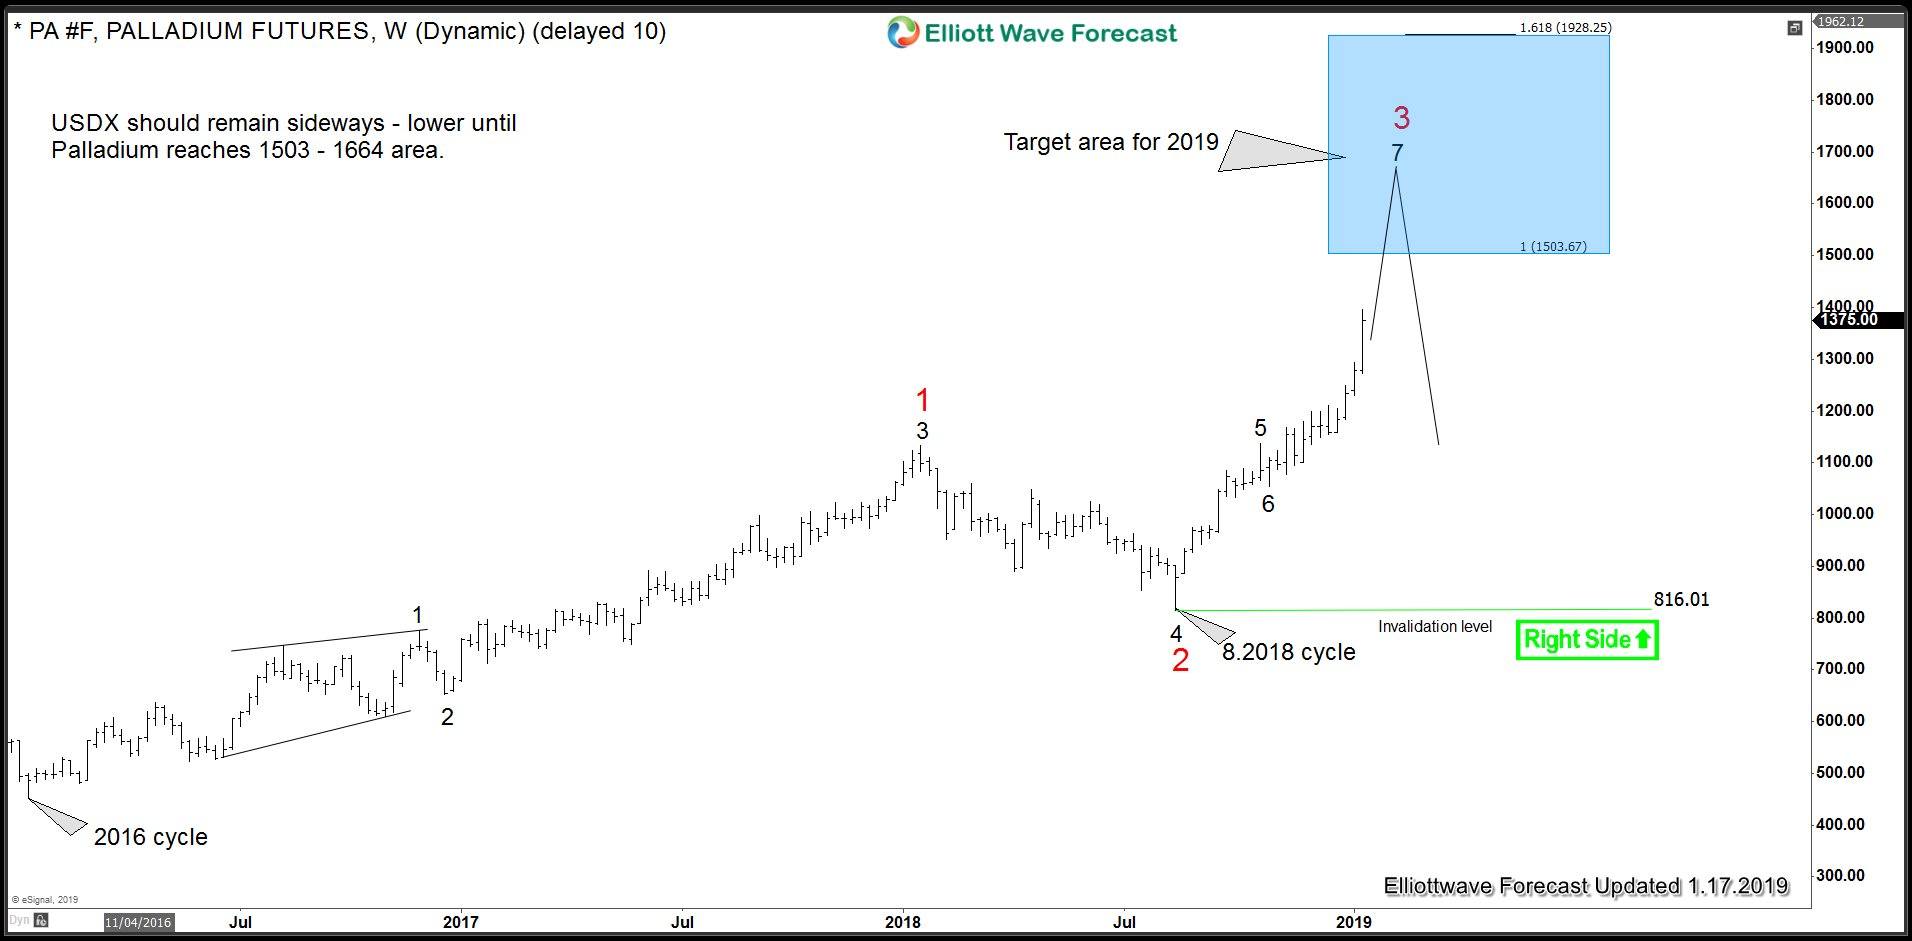
Palladium Elliott Wave Weekly Chart 1.17.2019

In the yearly forecast, we were looking for a August 2018 cycle to end in blue box (1503 – 1664 as noted on the chart) and a reaction lower to take place. We were looking fora larger pull back that will correct the cycle from the 816.01 low at least.  As our members know, Blue Boxes are no enemy areas , giving us 85% chance to get a reaction.

Eventually Palladium reached proposed blue box in weekly chart and August 2018 cycle ended at 1577.07 high.

Chart

Now,let’s take a loot at the short term price structures.

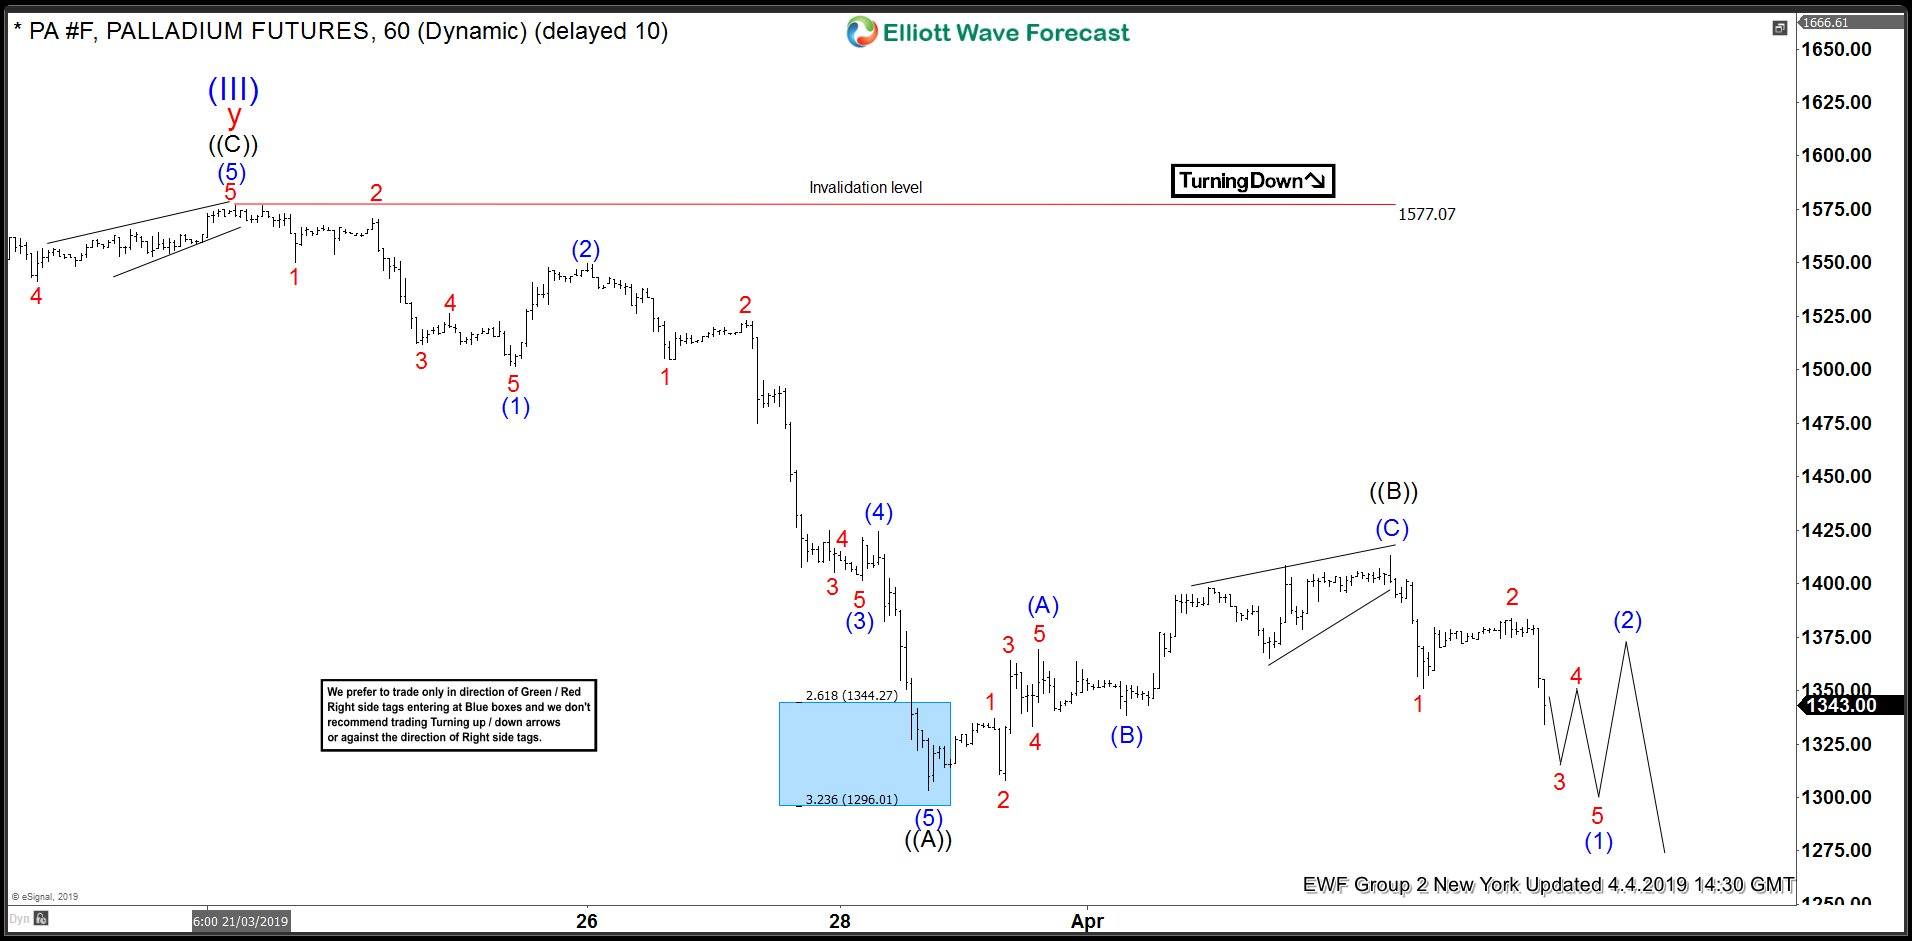
Palladium Elliott Wave 1 Hour  Chart 4.4.2019

The price ended short term cycle from the 1577.07 peak as 5 waves structure, labeled as wave ((A)) black.  We ended clear 3 waves bounce against the 1577.07 high, hence short term recovery can be counted completed as ((B)) black. Now we need to see break below wave ((A)) – 03/28 low to get confirmation next leg down ((C)) is in progress.

Chart

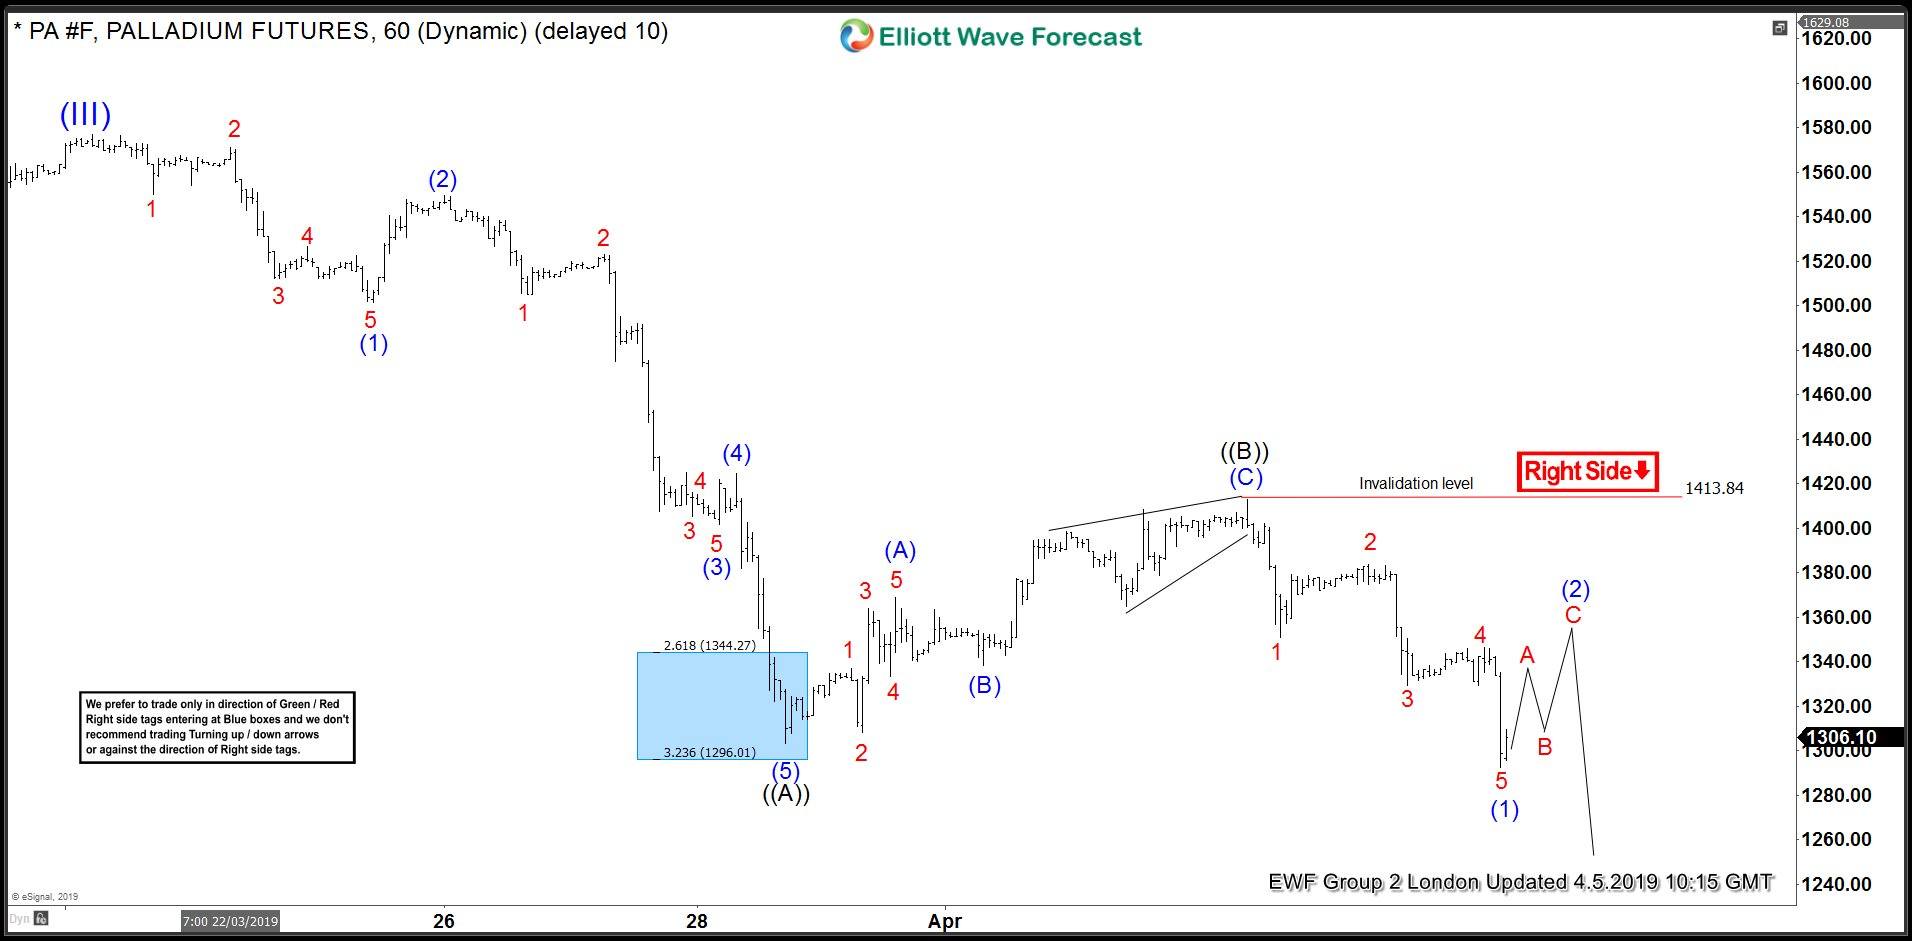
Palladium Elliott Wave 1 Hour  Chart 4.5.2019

The price has broken 03/28 low. Consequently , the commodity is now showing lower low sequences down from the 1577.07 peak. Palladium became bearish against the 1413.84 pivot. Seems like we are ending 5 waves down from the mentioned peak most likely. Consequently we are calling for further weakness. We expect short term bounce to correct the cycle from the 1413.84 high before further decline takes place. Proposed bounce should ideally reach 50-61.8 % Fibonacci Retracement area.

Chart

Palladium Elliott Wave 1 Hour  Chart 4.10.2019

Finally we got proposed bounce. The price is correcting the cycle from the 1413.6 high, when recovery is labeled as ABC red Zig Zag Pattern. As of right now we can still be in C red that can be unfolding as ending diagonal.  As far as the price stays above bottom wedge line, we can get another short term high in wave ((v)) of C . We don’t recommend buying Palladium and favor the short side against the 1413.61 peak. Alternatively if 1413.61 pivot gives up, we can be doing Irregular Flat against the 1577.07 peak toward 1402-1469 area.

Keep in mind market is very dynamic and proposed view could have ended in the mean time. You can check most recent updates in the Membersip Area of the Website .  Best instruments to trade are those having incomplete bullish or bearish swings sequences. We put them in Sequence Report and best among them are shown in the Live Trading Room.

Chart


Become a Successful Trader and Master Elliott Wave like a Pro. Start your Free 14 Day Trial at - Elliott Wave Forecast.

FURTHER DISCLOSURES AND DISCLAIMER CONCERNING RISK, RESPONSIBILITY AND LIABILITY Trading in the Foreign Exchange market is a challenging opportunity where above average returns are available for educated and experienced investors who are willing to take above average risk. However, before deciding to participate in Foreign Exchange (FX) trading, you should carefully consider your investment objectives, level of xperience and risk appetite. Do not invest or trade capital you cannot afford to lose. EME PROCESSING AND CONSULTING, LLC, THEIR REPRESENTATIVES, AND ANYONE WORKING FOR OR WITHIN WWW.ELLIOTTWAVE- FORECAST.COM is not responsible for any loss from any form of distributed advice, signal, analysis, or content. Again, we fully DISCLOSE to the Subscriber base that the Service as a whole, the individual Parties, Representatives, or owners shall not be liable to any and all Subscribers for any losses or damages as a result of any action taken by the Subscriber from any trade idea or signal posted on the website(s) distributed through any form of social-media, email, the website, and/or any other electronic, written, verbal, or future form of communication . All analysis, trading signals, trading recommendations, all charts, communicated interpretations of the wave counts, and all content from any media form produced by www.Elliottwave-forecast.com and/or the Representatives are solely the opinions and best efforts of the respective author(s). In general Forex instruments are highly leveraged, and traders can lose some or all of their initial margin funds. All content provided by www.Elliottwave-forecast.com is expressed in good faith and is intended to help Subscribers succeed in the marketplace, but it is never guaranteed. There is no “holy grail” to trading or forecasting the market and we are wrong sometimes like everyone else. Please understand and accept the risk involved when making any trading and/or investment decision. UNDERSTAND that all the content we provide is protected through copyright of EME PROCESSING AND CONSULTING, LLC. It is illegal to disseminate in any form of communication any part or all of our proprietary information without specific authorization. UNDERSTAND that you also agree to not allow persons that are not PAID SUBSCRIBERS to view any of the content not released publicly. IF YOU ARE FOUND TO BE IN VIOLATION OF THESE RESTRICTIONS you or your firm (as the Subscriber) will be charged fully with no discount for one year subscription to our Premium Plus Plan at $1,799.88 for EACH person or firm who received any of our content illegally through the respected intermediary’s (Subscriber in violation of terms) channel(s) of communication.

Recommended Content


Recommended Content

Editors’ Picks

USD/JPY holds near 155.50 after Tokyo CPI inflation eases more than expected

USD/JPY holds near 155.50 after Tokyo CPI inflation eases more than expected

USD/JPY is trading tightly just below the 156.00 handle, hugging multi-year highs as the Yen continues to deflate. The pair is trading into 30-plus year highs, and bullish momentum is targeting all-time record bids beyond 160.00, a price level the pair hasn’t reached since 1990.

USD/JPY News

AUD/USD stands firm above 0.6500 with markets bracing for Aussie PPI, US inflation

AUD/USD stands firm above 0.6500 with markets bracing for Aussie PPI, US inflation

The Aussie Dollar begins Friday’s Asian session on the right foot against the Greenback after posting gains of 0.33% on Thursday. The AUD/USD advance was sponsored by a United States report showing the economy is growing below estimates while inflation picked up.

AUD/USD News

Gold soars as US economic woes and inflation fears grip investors

Gold soars as US economic woes and inflation fears grip investors

Gold prices advanced modestly during Thursday’s North American session, gaining more than 0.5% following the release of crucial economic data from the United States. GDP figures for the first quarter of 2024 missed estimates, increasing speculation that the US Fed could lower borrowing costs.

Gold News

FBI cautions against non-KYC Bitcoin and crypto money transmitting services as SEC goes after MetaMask

FBI cautions against non-KYC Bitcoin and crypto money transmitting services as SEC goes after MetaMask

US FBI has issued a caution to Bitcoiners and cryptocurrency market enthusiasts, coming on the same day as when the US Securities and Exchange Commission is on the receiving end of a lawsuit, with a new player adding to the list of parties calling for the regulator to restrain its hand.

Read more

Bank of Japan expected to keep interest rates on hold after landmark hike

Bank of Japan expected to keep interest rates on hold after landmark hike

The Bank of Japan is set to leave its short-term rate target unchanged in the range between 0% and 0.1% on Friday, following the conclusion of its two-day monetary policy review meeting for April. The BoJ will announce its decision on Friday at around 3:00 GMT.

Read more

Majors

Cryptocurrencies

Signatures