Market sentiment negative ahead of Powell and PCE inflation

Market Overview
There has been a real negative shift in market sentiment since the Jerome Powell testimony a couple of days ago. Suddenly not only three, but perhaps even four hikes need to be priced in by the market, and this is impacting across global markets. Powell’s belief that inflation is heading higher and that the FOMC would need to reassess its dot plot expectations at the next meeting have worried markets. Rising inflation is a driver of tighter monetary policy but not in a good way, and this is driving equity markets lower and deteriorating risk appetite and equities are selling off again. It is interesting to see the reaction on the bond markets, where the 2s/10s spread has actually fallen, with the curve flattening. Shorter term rate expectations have risen by the longer end is not moving as much. This risk reduction is driving a stronger dollar but also yen strength too. Powell speaks again before the Senate Banking Committee today so it will be interesting to see if he dials back at all, considering the market reaction. However, there is also the Fed’s preferred gauge of inflation, the core PCE to be announced today, will we start to see some upside traction? None is expected, with a flat +1.5% on the consensus, however an upside surprise would really stoke the market fears again. Sterling is under pressure from Brexit politics as the Northern Irish border issue begins to really flash the red warning lights. Can Theresa May’s speech tomorrow change the narrative?
Wall Street saw a second day of sharp selling pressure yesterday with the Dow off 380 ticks and the S&P 500 down -1.1% at 2714. Asian markets reacted equally negatively, with the Nikkei -1.6%, whilst European markets are all sharply lower in early moves today. In forex markets there is a degree of consolidation with the dollar rally on pause. In commodities, although gold is $3 lower, the oil price has just consolidated a touch.
Traders will be focusing on the testimony of Jerome Powell again today, however with regards to economic data, it is US inflation and the PMIs on the agenda. The Eurozone PMIs are first up in the early European session with the Eurozone final Manufacturing PMI at 0900GMT which is expected to be confirmed at 58.5 (in line with the flash 58.5). The UK Manufacturing PMI is at 0930GMT and is expected to tick lower to 55.0 (from 55.3 last month). The US ISM Manufacturing is at 1500GMT and is expected to drop slightly to 58.7 (from 59.1 last month). However the big focus will be the Fed’s preferred inflation measure at 1330GMT, the core Personal Consumption Expenditure which is not expected to move from last month’s +1.5% even though inflation is beginning to show signs of life elsewhere. Aside from these tier one data releases, the market will also be looking out for US Weekly Jobless Claims at 1330GMT which is expected to stay at 226,000 again.

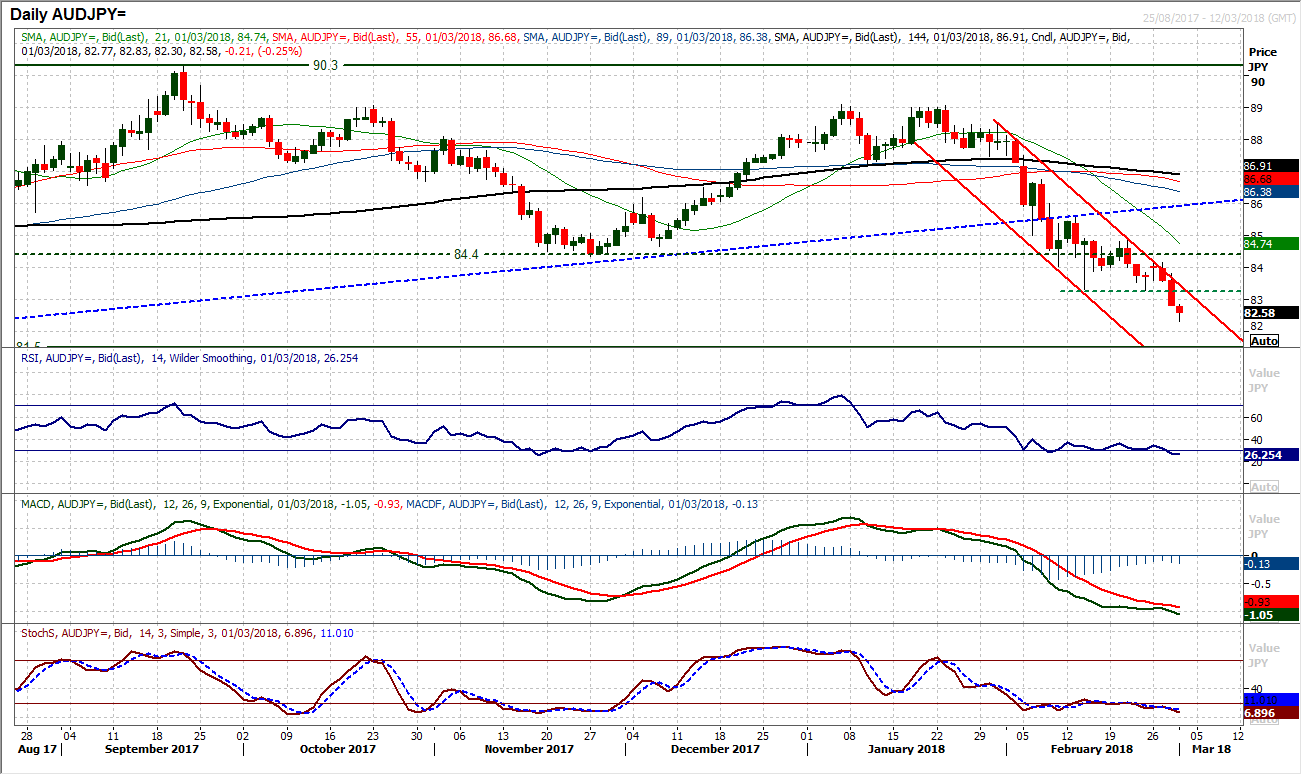
Chart of the Day – AUD/JPY
Aussie/Yen has been trending lower for much of the past six weeks in a move that has significantly impacted the longer term outlook. The market has found traction below the old key low at 84.40 in recent weeks but the more risk averse moves on global markets in recent days has once more seen the pair break down. The support around 83.30 had held over the past couple of weeks, but two consecutive strong bear candles have decisively broken 83.30 support taking the market to its lowest level since June last year. The market continues the downtrend channel of the past six weeks but more importantly continues the retreat towards the key lows of April/June last year between 81.50/81.80. Rallies continue to be sold into and the hourly chart shows a resistance band now in place 83.30/83.70 which is now a near term “sell-zone”. There is little real support now until 81.50/81.80 although there is a minor level to watch at 82.60. It would need a move above 84.15 for the bulls to gain any real traction in a recovery.
EUR/USD
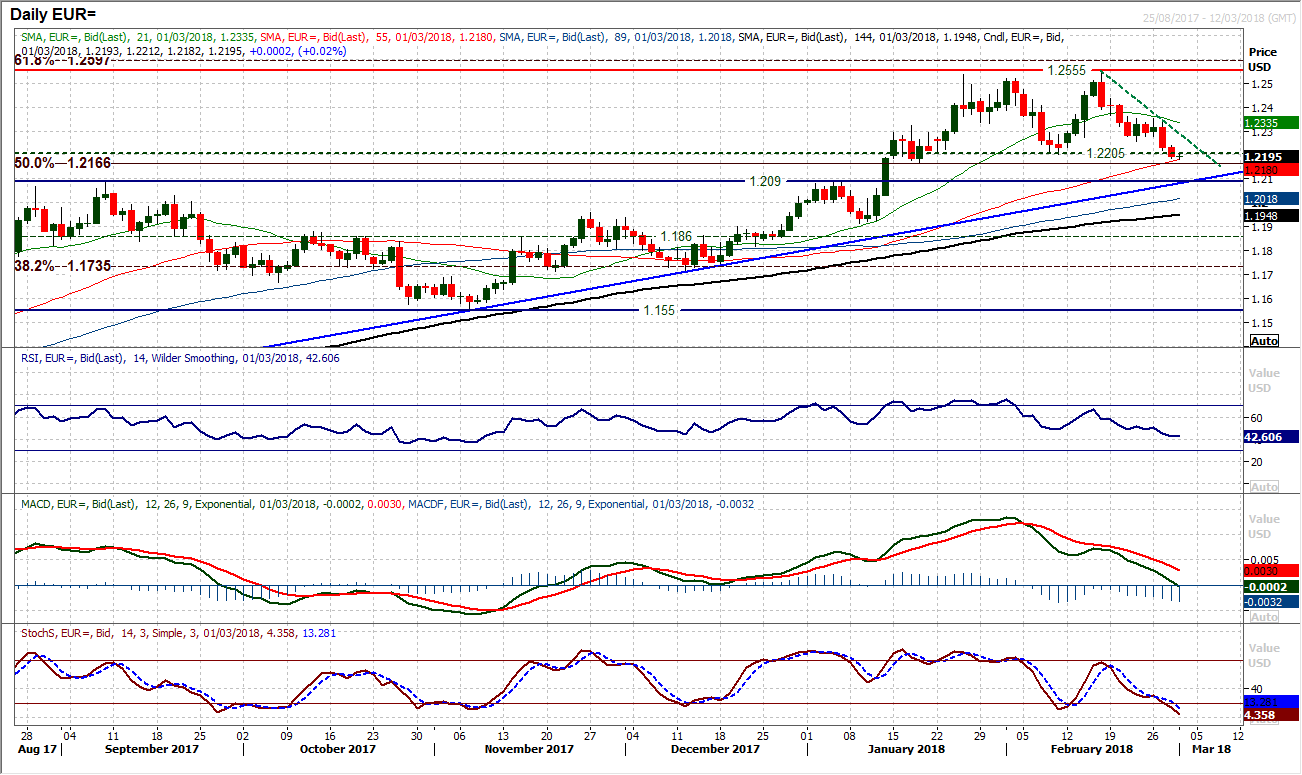
The strengthening dollar in the wake of a hawkish Jerome Powell has now dragged EUR/USD back below the key $1.2205 February low. In isolation this completes a double top pattern, however is this a decisive sell signal? There is a key breakout support at $1.2090 in place from the September/December highs which coincides with the support of the ten month uptrend. If these were to be broken then it would be a decisive change of outlook, however the trend is still positive on a medium term basis. Momentum indicators are certainly corrective now near term, but not decisively bearish and look still to be more of a near term correction within a bullish medium term market. There is therefore still room for further weakness near term and there is now a resistance band $1.2205/$1.2260 on the hourly chart. Support is at $1.2165 before $1.2090.
GBP/USD
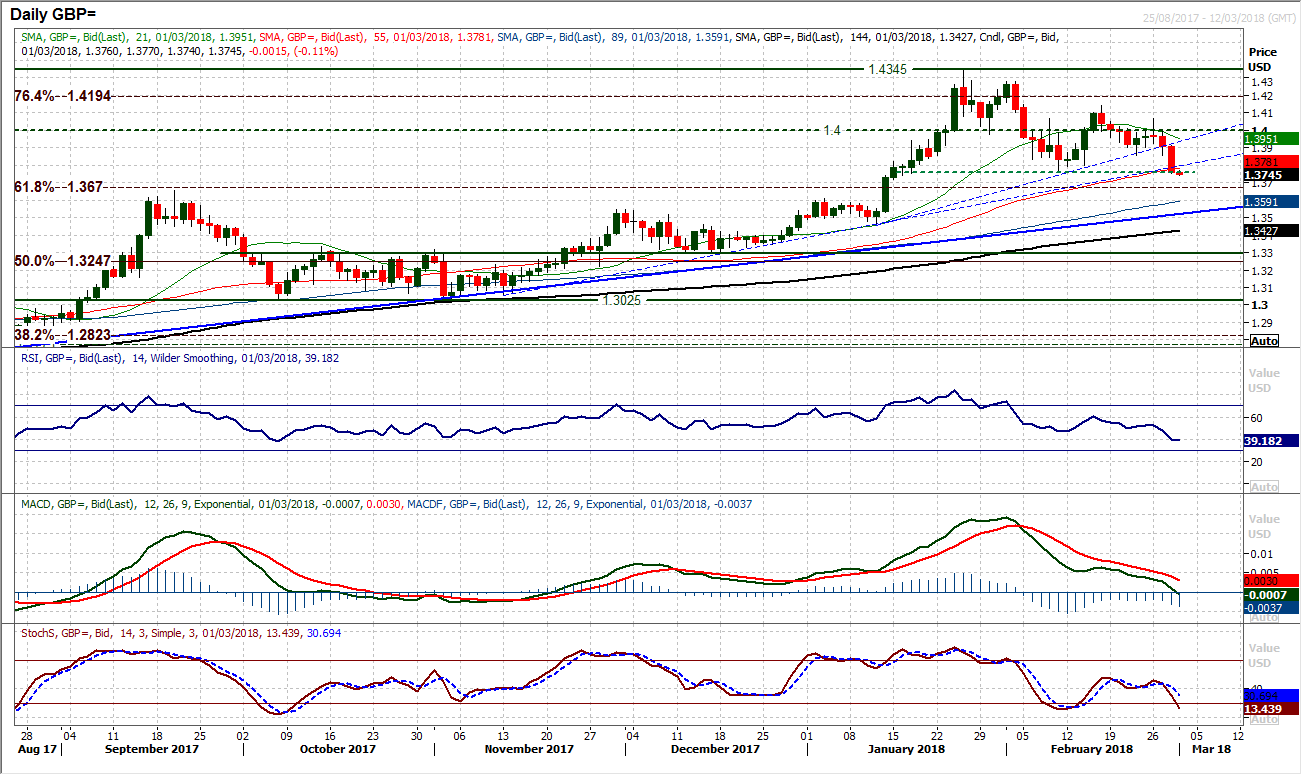
In the last couple of sessions, Cable has been hit by the double whammy of a more hawkish Jerome Powell (driving dollar strength) and concerns over Brexit (driving sterling weakness). This has brought the market back to a test of the $1.3765 previous February low, which was marginally breached yesterday without a decisive move. There are a series of uptrends that have been breached by the slip in the last couple of days, the latest being a three and a half month uptrend now creaking today, but the big primary uptrend that dates back for over a year comes in down at $1.3520 today. So for now this remains a near to medium term correction within a longer term bull trend. The momentum indicators are corrective though with the MACD and Stochastics accelerating lower now. A decisive breach of $1.3765 would open $1.3550/$1.3600. The bulls will also now struggle with the overhead supply $1.3765/$1.3855 which could now act as a sell zone.
USD/JPY
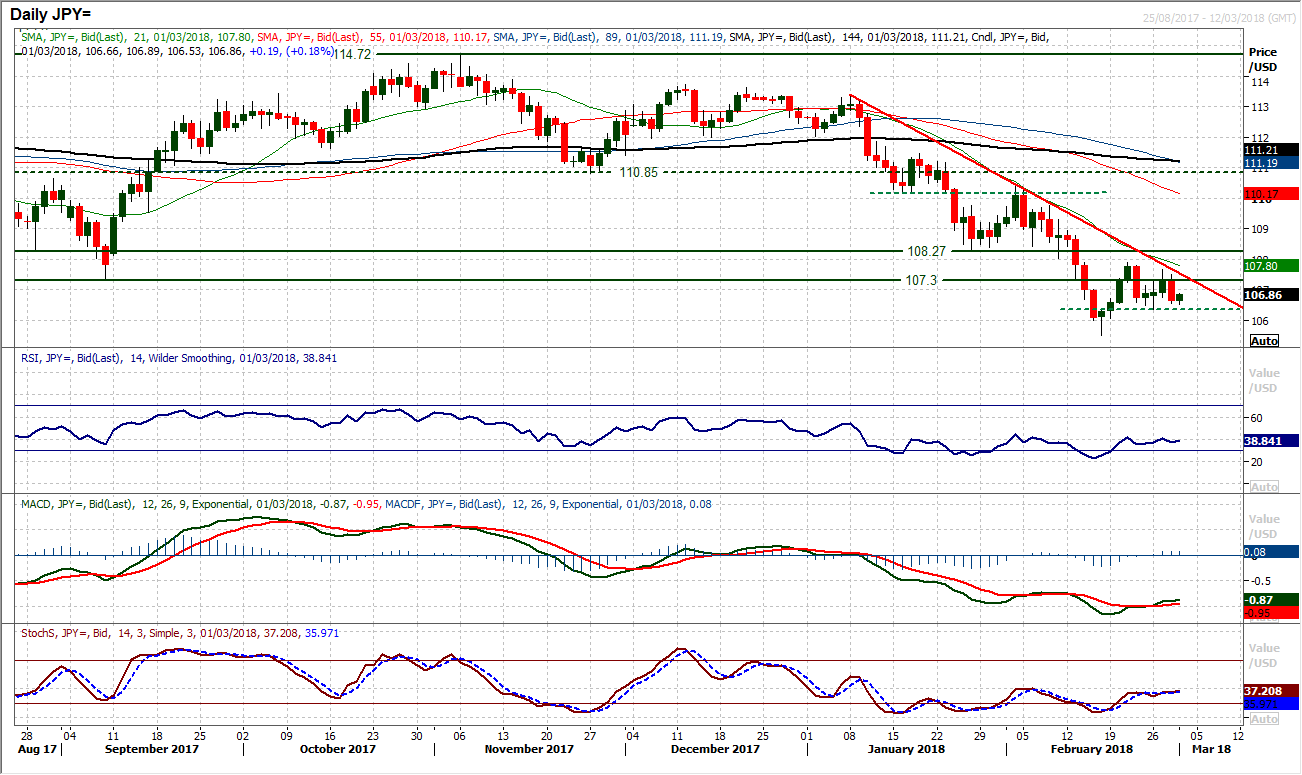
The dollar may be strengthening across the majors, but the yen continues to hang tough as a bear candle formed yesterday to maintain the seven week downtrend. This is more of a consolidation on Dollar/Yen now as the market continues to hold up above last week’s low of 106.35 but cannot find the traction in a recovery. The overhead supply between 107.30/108.30 seems to be housing enough sellers to prevent a sustainable move to the upside. Resistance at 107.90 and now 107.65 help to form the downtrend. The configuration on momentum is still negative with the RSI struggling under 40 and Stochastics also pointing to selling into strength. The hourly chart reflects the consolidation over the past week or so, with oscillations between 30/70 on the hourly RSI and flat moving averages. Initial support at 106.35/55 continues to prevent a slip back to test 105.50.
Gold
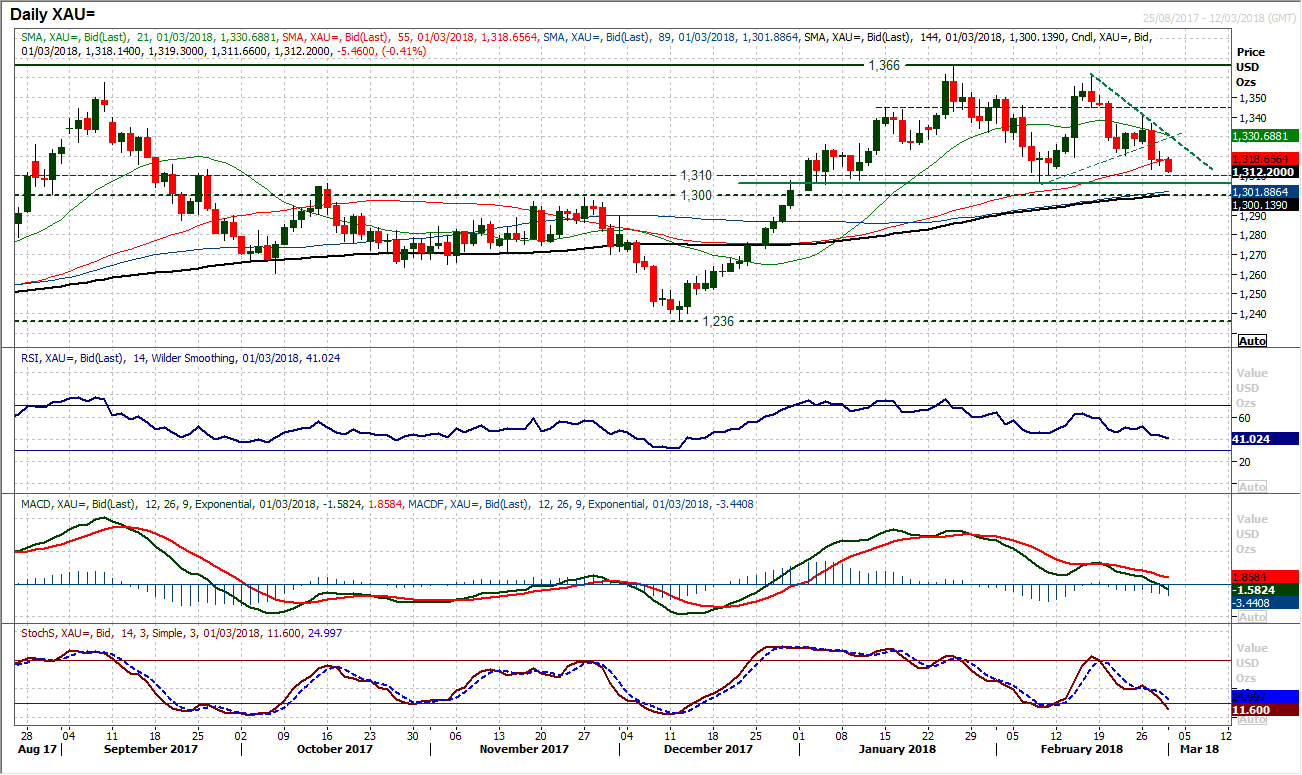
The stronger dollar is dragging gold back lower again and a test of the key February low of $1306.80 is becoming increasingly likely now. The long term pivot band $1300/$1310 remains supportive and is a key level to watch as if gold begins to trade decisively in the $1200s then this would mark a significant shift in the outlook. Momentum indicators are negatively configured near term with the MACD and Stochastics accelerating lower. If the RSI begins to move below 40 then this would be a negative signal too. Early weakness today is also a concern for the bulls after yesterday’s “doji” consolidation candle seemed to settle the nerves. There is now a small two week downtrend today at $1332 which needs to be broken to suggest the bulls are regaining traction again. The hourly chart shows the resistance band $1320/$1325 is near term overhead supply.
WTI Oil
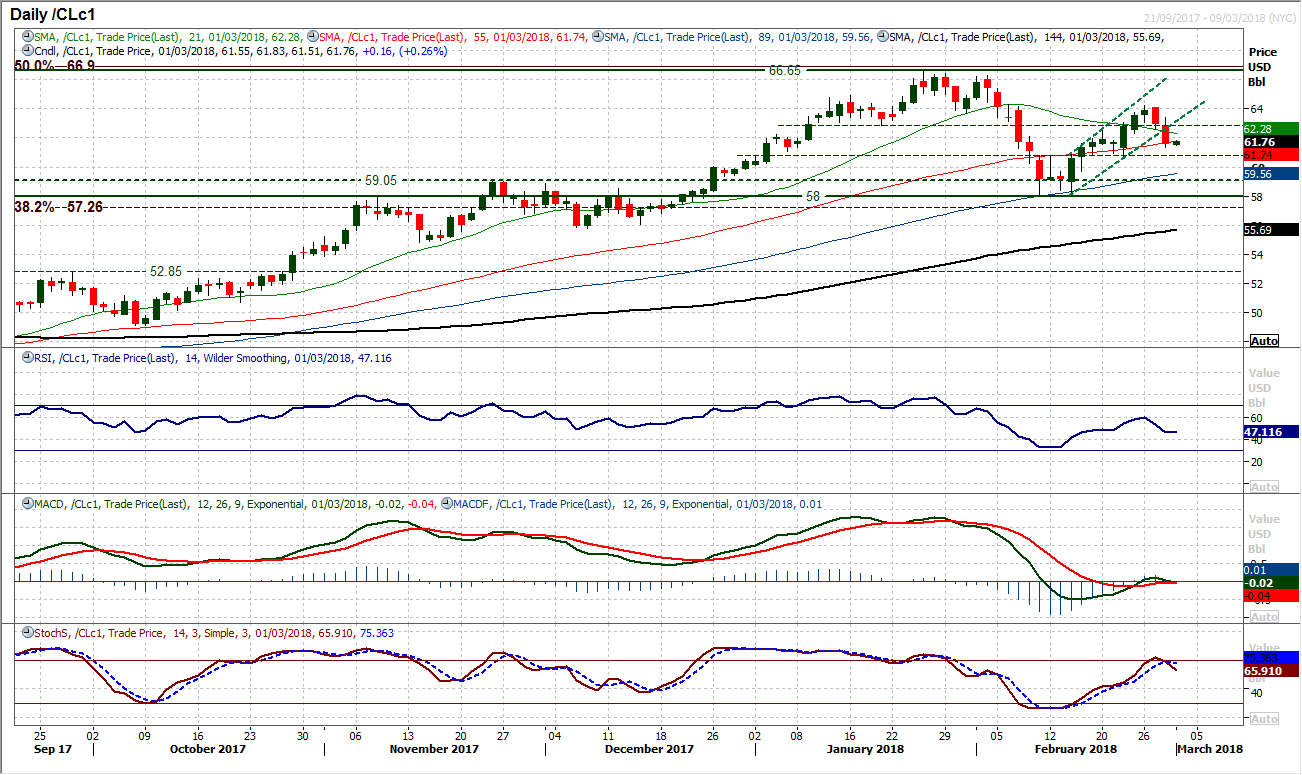
Even though the EIA inventories showed higher than expected builds for crude and gasoline stocks, the price of WTI came under pressure yesterday (from a stronger dollar and deteriorating risk appetite). The market has subsequently formed a second successive negative candle which now questions the recovery again. The market has now broken the mini uptrend channel of the recent recovery and the daily momentum indicators have rolled over. The deterioration in the past couple of days shows that the bulls have lost their control, at least for now. However this could still simply be playing out as part of a consolidation. The move back below the pivot at $62.85 is clearly a disappointment for the bulls but the bears will only reclaim control should the support at $60.75 be lost. The momentum indicators are now becoming neutral in configuration with the MACD lines plateauing around the zero line, whilst the RSI is back around 50. There is now resistance at $64.25 from this week’s high, with yesterday’s rebound to $63.45 adding further resistance.
Dow Jones Industrial Average
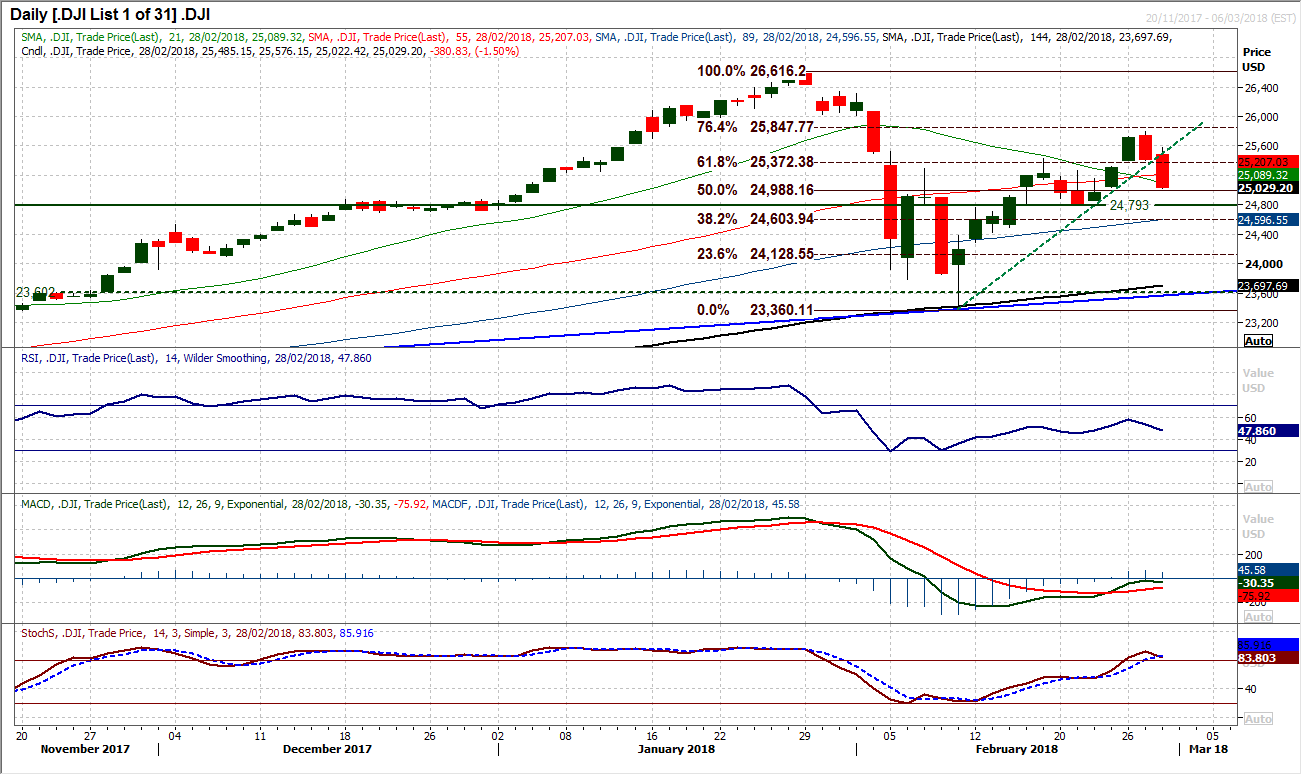
The bulls are in retreat again after a second strong bear candle now threatens the recovery. Upside gaps are now being closed and the recovery uptrend has been decisively broken. Momentum indicators are rolling over and worryingly the MACD lines (which are more of a medium to longer term gauge) are rolling over around neutral. If a third bear candle is formed today then the market could really begin to gather momentum to the downside. The 50% Fibonacci retracement of the big sell-off at 24,988 will now be watched keenly as if this is breached, again the bears will be interested, whilst a move below the key reaction low at 24,793 would mean recovery lost and bear control again. The hourly chart shows the momentum indicators have used this drop back to unwind overbought near term momentum and are on the limit now with hourly RSI just above 30 and hourly MACD lines just above neutral. This could be a key outlook defining session today. The bulls need to come out in force.
Author

Richard Perry
Independent Analyst


