Major markets in a relief rally but can China really 'reverse the tide'? [Video]
![Major markets in a relief rally but can China really 'reverse the tide'? [Video]](https://editorial.fxstreet.com/images/Macroeconomics/Countries/Asia/China/china-oil-6954163_XtraLarge.jpg)
Market Overview
It has been a tumultuous week on financial markets, with majors swinging around on newsflow of the Coronavirus. The latest move has come overnight, as something of a relief rally is forming. The WHO has declared a global health emergency but interestingly did not recommend a travel ban on China. It also noted that it sees China’s response as being able to “reverse the tide”. It is far too early to say that this is a key turning point in the market response, but a relief rebound has been seen across markets. This has been added to by the Chinese PMIs overnight which has not deteriorated as perhaps they might have done considering the country is gripped by the Coronavirus. China Manufacturing PMI came in as expected bang on 50.0 (50.0 exp, 50.2 last) whilst China Non-Manufacturing PMI improved to 54.1 (53.5 last). A traditional risk knee jerk rally, with bond yields higher, gold and the yen slipping, whilst equities rebound and oil is back higher. The question is whether this can last? The Coronavirus is still spreading with thousands of new cases in China every day, whilst the death toll is also rising (and accelerating). Perhaps if people start dying outside China, that could lead to the next bear leg lower, but this morning, there is a more settled look to market moves. However, volatility remains elevated and traders are on edge. The choppy market moves are likely to continue for a while yet.

Wall Street bounced strongly into the close, with the S&P 500 rallying over a percent from its intraday lows to close +0.3% higher at 3283. US futures are a little more circumspect this morning -0.1%, however, Asian markets have taken heart with the Nikkei +1.0% higher. In Europe, there is an account for the late Wall Street rally, with FTSE futures +0.4% and DAX futures +0.5%. In forex, there is a continuation of the recent USD strength, but interestingly with less risk aversion. GBP also continues to rebound following yesterday’s BoE related gains. In commodities, there is a consolidation on gold, whilst oil has opened over +1% higher.
On the last day of the month, there is a lot of data to wade through on the economic calendar. Starting with Eurozone inflation for January which is throughout the morning for individual countries, but the Eurozone flash HICP is at 1000GMT and is expected to see the headline HICP improve to +1.4% (from +1.3% in December) whilst core HICP is expected to slip a shade to +1.2% (+1.3% in December). Eurozone flash GDP is also at 1000GMT which is expected to be +0.2% for Q4 (from +0.2% in Q3) and annualised at +1.1% (down from +1.2% in Q3). Into the US session is we have Core Personal Consumption Expenditure at 1330GMT which is expected to remain at +1.6% in December (+1.6% in November). The US Employment Cost for Q4 is also at 1330GMT and is expected to remain at +0.7%. Final University of Michigan Sentiment is at 1500GMT and is expected to be unrevised at 99.1 (from 99.1 prelim and 99.3 December final).
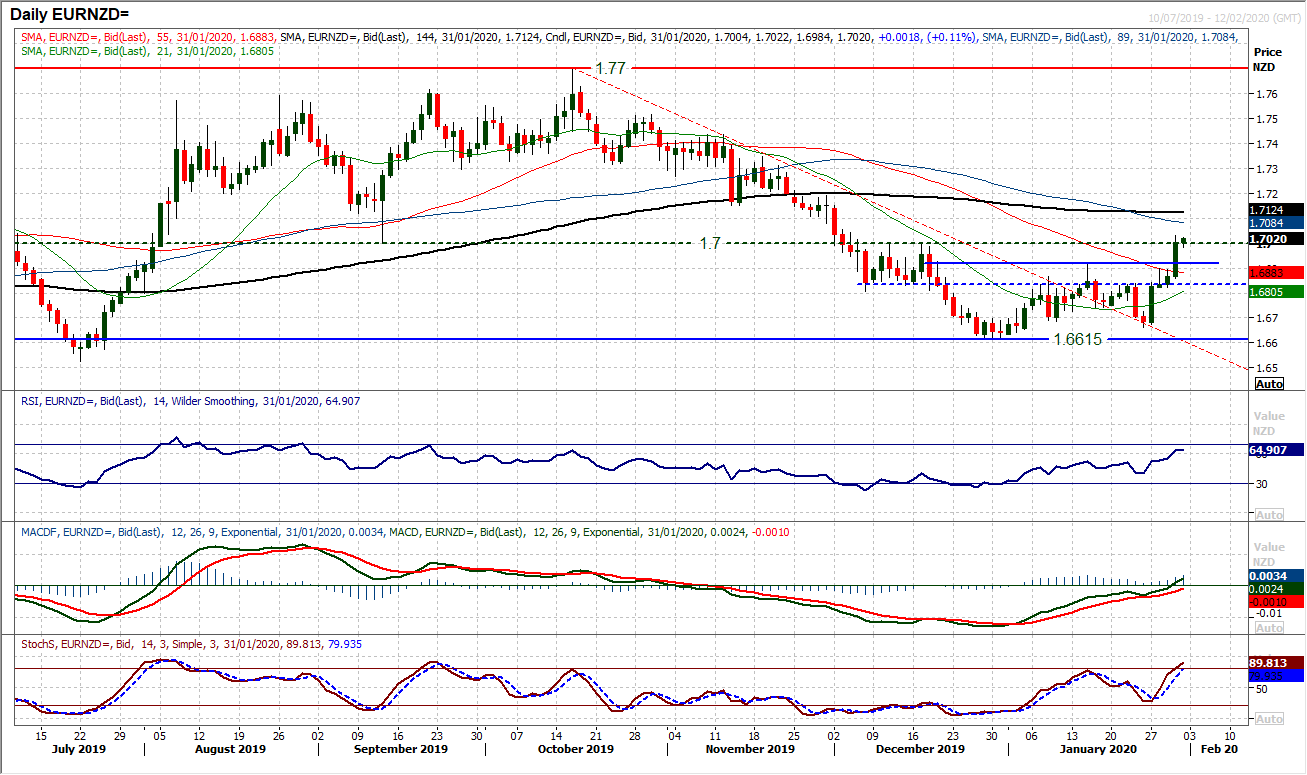
Chart of the Day – EUR/NZD
January has been a month where the strong performance of the New Zealand dollar has begun to unwind. Furthermore, in the past week, there has seen a sharp move out of higher beta risk majors such as the Kiwi, at a time where the euro has begun to consolidate. This has driven a decisive base pattern formation on EUR/NZD. Yesterday’s big bull candle through resistance at 1.6920 has completed a double bottom pattern which implies a recovery target of around 1.7180. The euro bulls are certainly running with the move, with momentum indicators turning strongly positive now, with RSI above 60 at multi-month highs and a “bull kiss” on MACD lines. Making it decisively through the old pivot at 1.7000 would also be a sign of growing strength. Given the sharp overbought position on the hourly chart, we would be looking to use weakness as a chance to buy. There is now neckline support at 1.6920 whilst another pivot at 1.6835 making this a buy zone for near term pullbacks. This support band is shown well on the hourly chart too. Above 1.7000 after yesterday’s high of 1.7030, there is little real resistance until 1.7150/1.7190.
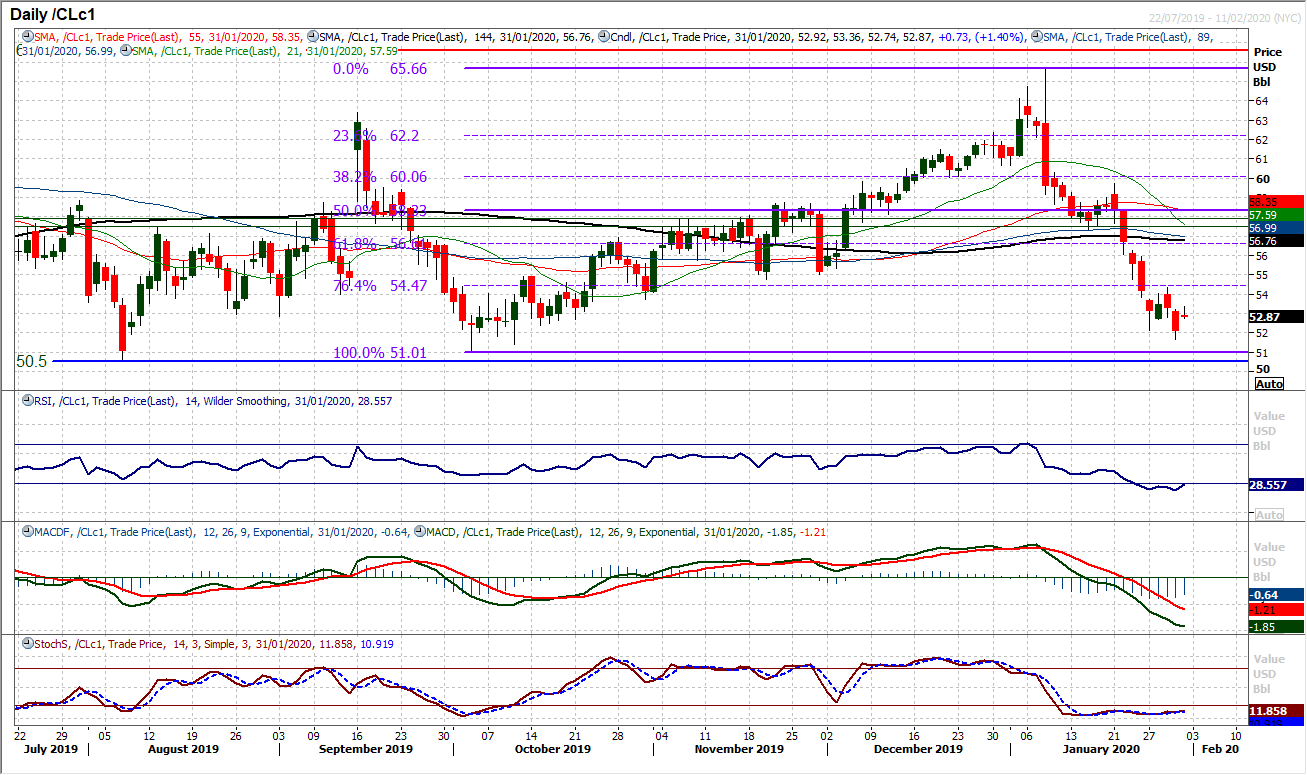
WTI Oil
The outlook on oil has been rather choppy in the past few sessions. An initial rebound failed in the wake of the EIA crude inventory build to leave a couple of bear candles threatening lower once more. However, a sharp early rebound today is adding recovery potential once more. Given the trend was sharply lower last week, this is a shift in sentiment and the bears seem to no longer be in control. The proximity to the crucial support band $50.50/$51.00 should also not be ignored. The prospects of a sustainable rally would really be determined by the 23.6% Fibonacci retracement (of $51.00/$65.65) at $54.45 which would also be above this week’s rebound high of $54.35. With this morning’s rebound, RSI is also threatening a move above 30, but needs a closing break. For now, this is too early to suggest a recovery, it is more of a basis of support. However, the hourly chart configuration is far less bearish now and at least the bulls have something to build on. Support at $51.65 initially.
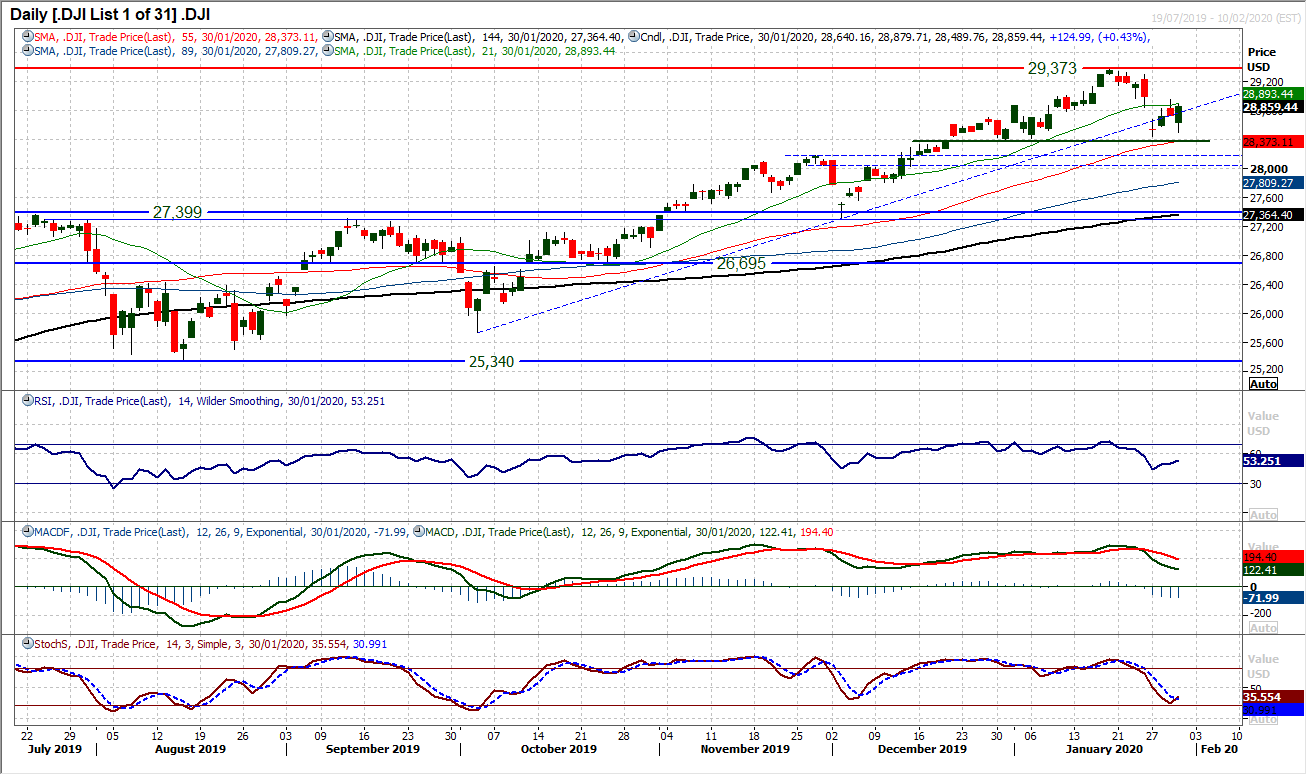
Dow Jones Industrial Average
News flow surrounding the Coronavirus has been throwing equities around in recent sessions, but there seems to continue to be an appetite to buy into weakness. Yesterday’s initial selling pressure was sharply turned round into the close to leave a strongly positive candle. Furthermore, the move has now finally closed Monday’s downside gap (at 28,843). Technically, this reaction higher could have a significant impact on the outlook. The bulls will now be looking to build on this move, but a close back above this week’s high at 28,944 would now be a strong signal. Coming as the Stochastics begin to cross back higher, it would be back above the 21 day moving average and suggest the bulls are back in control. The appetite to buy into weakness is also helping to strengthen the support of the key higher low at 28,376 too, adding 28,490 (yesterday’s low) to 28,440. The hourly chart needs to just settle down with the RSI back above 60 and MACD lines above neutral to confirm the improvement in outlook. A failure to overcome 28,944 would increase uncertainty over the outlook once more.
Author

Richard Perry
Independent Analyst


