Is there a gold rush?

Gold has been acting pretty volatile the past couple of days. While it might not look like much on the hourly chart, the 5 minute chart shows a lot of hidden gems of what is happening in the precious metal. Since the return from the long holiday, the precious metal has been moving all over the place, attempting to break above the $1,895 resistance level.
Fundamentally Speaking
The yellow metal has been affected by a plethora of market shenanigans, that range from the U.S. stimulus measures to the COVID-19 Vaccine, passing through the Brexit situation. On Tuesday, XAU managed to regain the positive traction and was being heavily supported by the progress on additional U.S. stimulus measures.
The House of Representatives voted in favour of increasing the amount of COVID-19 relief payments to qualified Americans from $600 to $2,000 on Monday. This affected the metal indirectly, since the stimulus payment added bearish pressure on the dollar, which in turn gave Gold bullish pressure to rise back higher.
Moreover, there is increased optimism in the market, especially when it comes to the GBPUSD, with the last-minute Brexit deal which added investor confidence across the market. The increase in risk appetite of investors was evident from the prevalent bullish sentiment around the global equity markets. This risk-on flow undermined the demand for the safe-haven asset which limited the upside of XAUUSD.
With that said, the underside is also quite heavily supported. There are growing worries that the discovery of a new strain of the Coronavirus, which has a higher infection rate, is going to force the global economy to fall once again. This has given the yellow metal enough of a cushion from any aggravated decrease in its value. However, trading volume is another issue to take into consideration.
Trading volume has remained quite thin, which is adding pressure on investors to stay prudent and not place aggressive bets. This might add further bearish pressure on Gold and contribute to cap the upside of the metal.
All these events combined prove that the best course of action for traders at the moment is a wait-and-see approach. Traders should wait for some follow-through in buying pressure before starting to level in their positions.
Technically Speaking
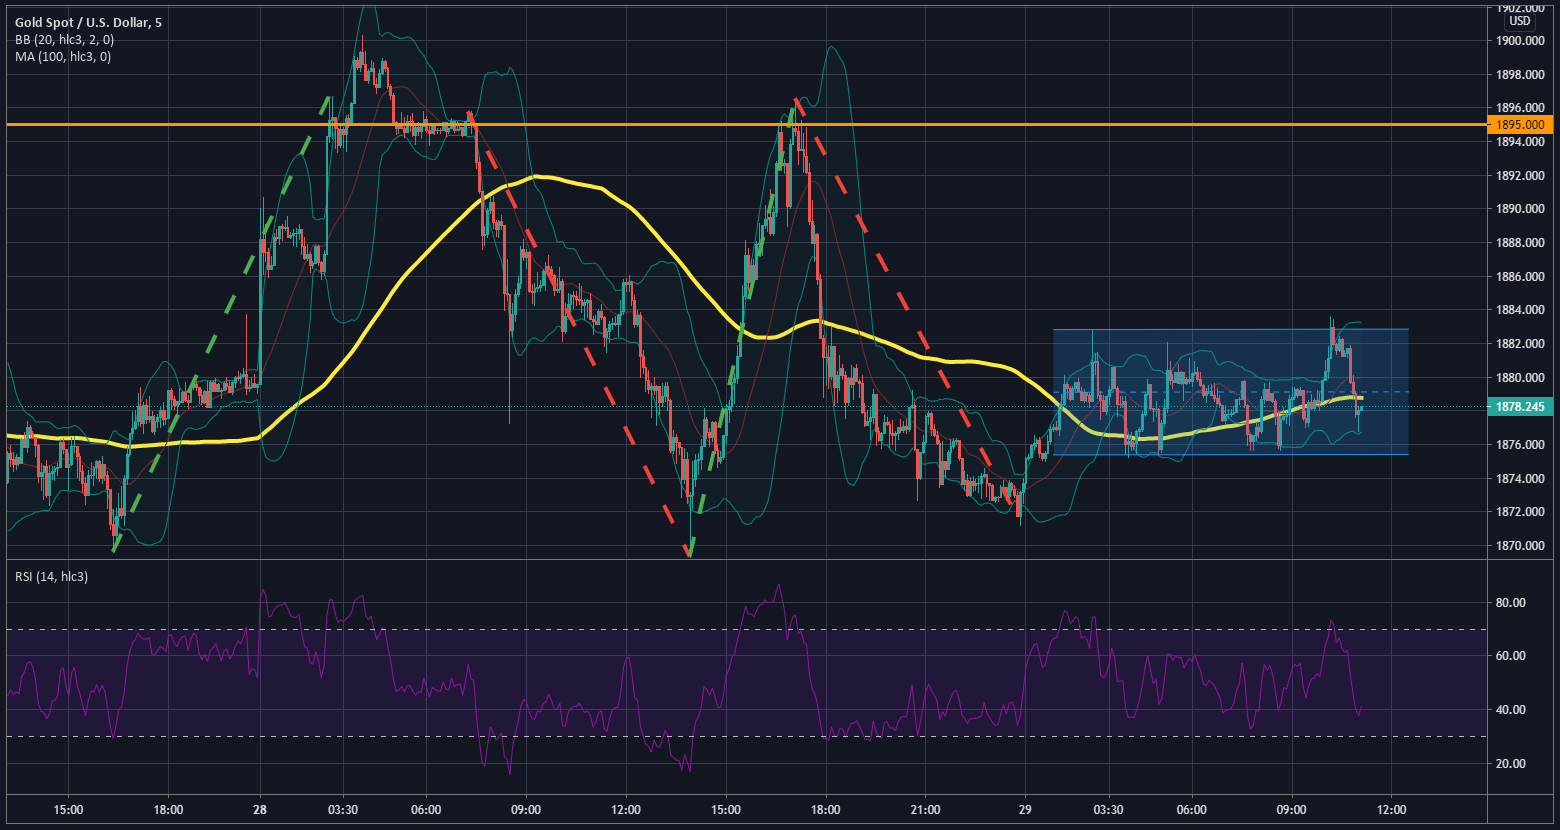
As I’ve mentioned in the beginning, while the Gold market might not look all that volatile on the hourly chart, the 5 minute chart, shows a whole different story. December 28th marked a day when the instrument rallied higher reaching a higher of $1,900 before encountering heavy resistance and sellers forced the instrument back down towards the $1,870.
There was an attempt to stabilize prices around the $1,895 which has been deemed as the skirmish line for the time being. However, the bearish pressure forced the instrument to fall to $1,870 as the Bulls found enough encouraging news to push back higher. Like I said, very volatile. Yet, Bulls were not able to keep hold of the momentum as the $1,895 rejected the break and the instrument fell back towards the $1,872.
Since then the instrument has been trading in a rather tight channel between the $1,883 on the top side and $1,875 as a bottom level. This gives the picture of consolidation, meaning that should there be a consistent break of either side, the market will follow through with that direction.
The Moving Average (yellow line), Bollinger Bands, and RSI (Relative Strength Index), are all providing approximately the same vision. Consolidation. At least for the time being as the market decides which way it wants to proceed.
The catalyst for the movement will most likely be technical in nature, as the opposing fundamental factors in the market at the moment are proving too much for either side. Hence, traders will more likely focus on the Technical aspect of things to see which way to go.
Author

Alexander Douedari
Independent Analyst
Alexander Douedari is an Award Winning Hedge Fund Manager and Selfmade 7-Figure Trader. Now Mentor for Students all around the world.


