Inverted Yield Curve and What It May Mean to the Indices

Last week, traders got spooked by the yield curve inversion of the most closely watched 2 year vs 10 year bonds. Yield curve inversion between 2 year and 10 year bond is a powerful predictor of recession. The 2-10 yield curve inversion preceded the past seven recessions from 1969. This means that the interest rates of the 10 year Treasury bonds bonds fall below the 2 year Treasury note. In a normal market, short term debt should be safer than the longer dated one as short term debt will be paid quickly. Short term debt in normal situation therefore should provide lower interest rate to the holders than the longer term debt.
In a yield curve inversion, the short term debt offers a higher interest rate. This potentially reflects a lack of confidence in the country's near-term economic health. That's what happened last week as the yield from 2 year US treasuries note became higher than the yield from 10 year bonds. The bond market thus flashed a warning signal even though US equity market is still relatively supported.
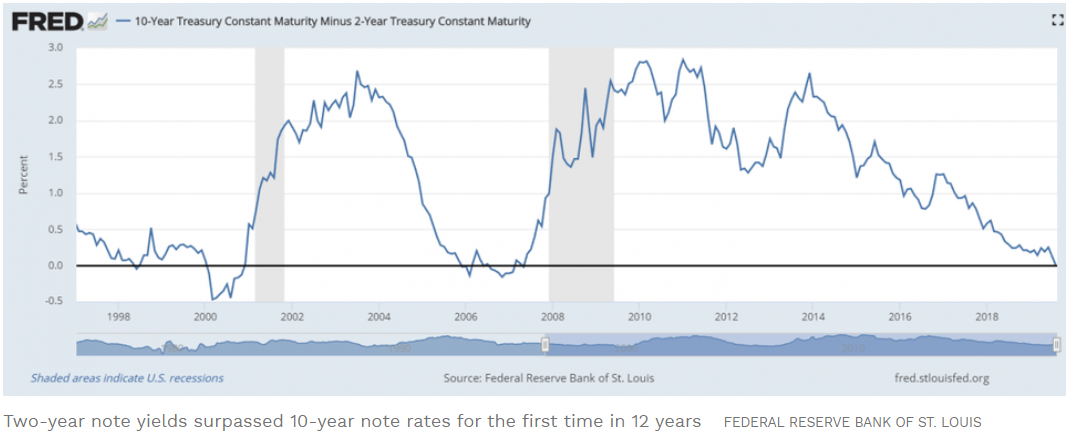
An inverted yield curve doesn't necessarily mean the stock market will turn bad immediately. It can take 2-3 years for a recession to hit after the 2 year and 10 year curve inverts. What this means though is that equity markets may be nearing its important peak. In the last recession, the yield curve inverted on December 27, 2005, which was 2 years before the Lehman's collapse sent the economy into recession. Other parts of the curve have already inverted. Last December, the yield on 5 year Treasury note fell below the yield on 3 year note. Then in March, the yield on the 3 month Treasury Bill fell bellow the yield on 10 year note. Concerns over global slowdown and uncertainties in US China trade war have weighed heavily on longer term US Treasury yields.
S&P 500 Long Term Elliott Wave View
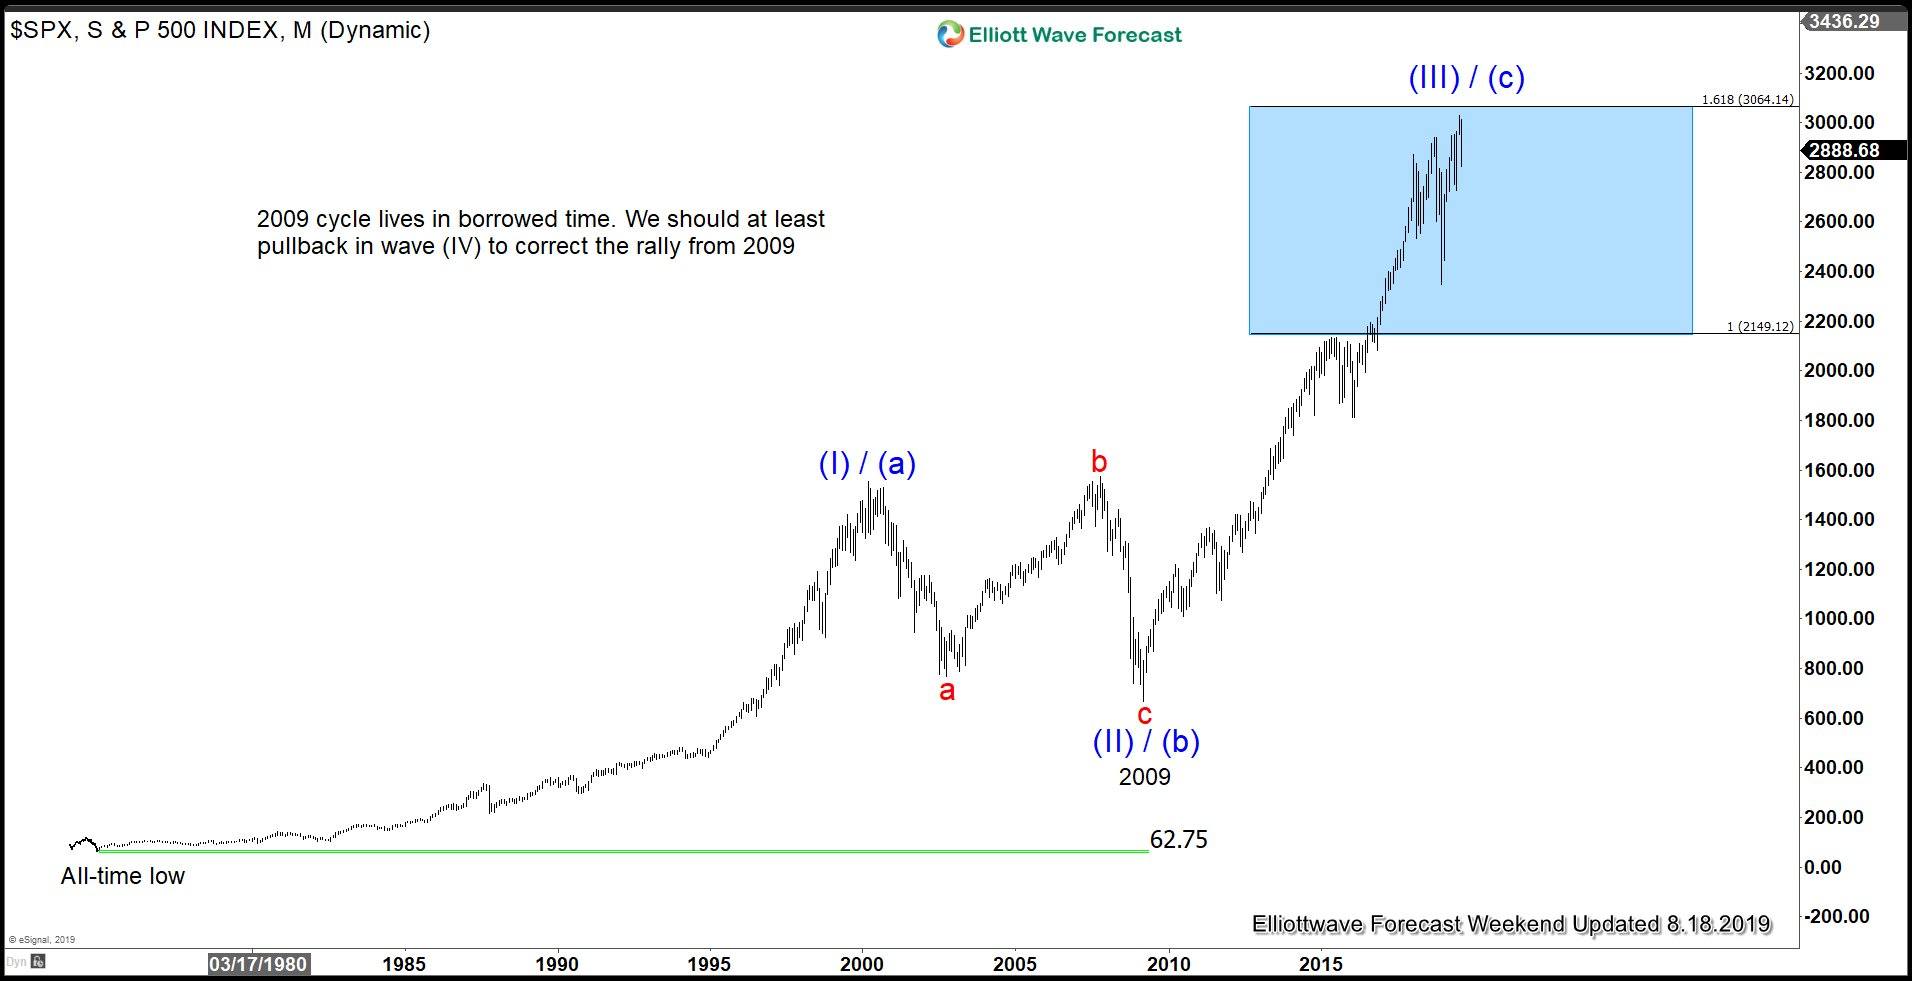
S&P 500 long term view above suggests that the entire rally from all-time low is in 3 waves. We can either label this move as (I)-(II)-(III) or alternatively as (a)-(b)-(c). Wave (I) / (a) ended in year 2000. The subsequent correction took the form of an expanded Flat and bottomed in 2009. Since then, we are in a 10 year bull run and the Index is now more or less reaching the 161.8% Fibonacci extension. If history is any indication, the stock market may still do last-gasp rally in wave (V) after the initial recession warning. However, at minimum, we at Elliottwave-Forecast.com believe cycle from 2009 is mature and lives on borrowed time. So expect at minimum a sizable pullback in wave (IV) in the next 6 months – 1 year.
The market will then decide if we only end cycle from 2009 in which case the Index then can do 1 more leg higher in wave (V). Alternatively, the entire rally from all-time low completed as (a)-(b)-(c) and we will then be in the biggest correction.
S&P 500 Shows Signs of Weakness
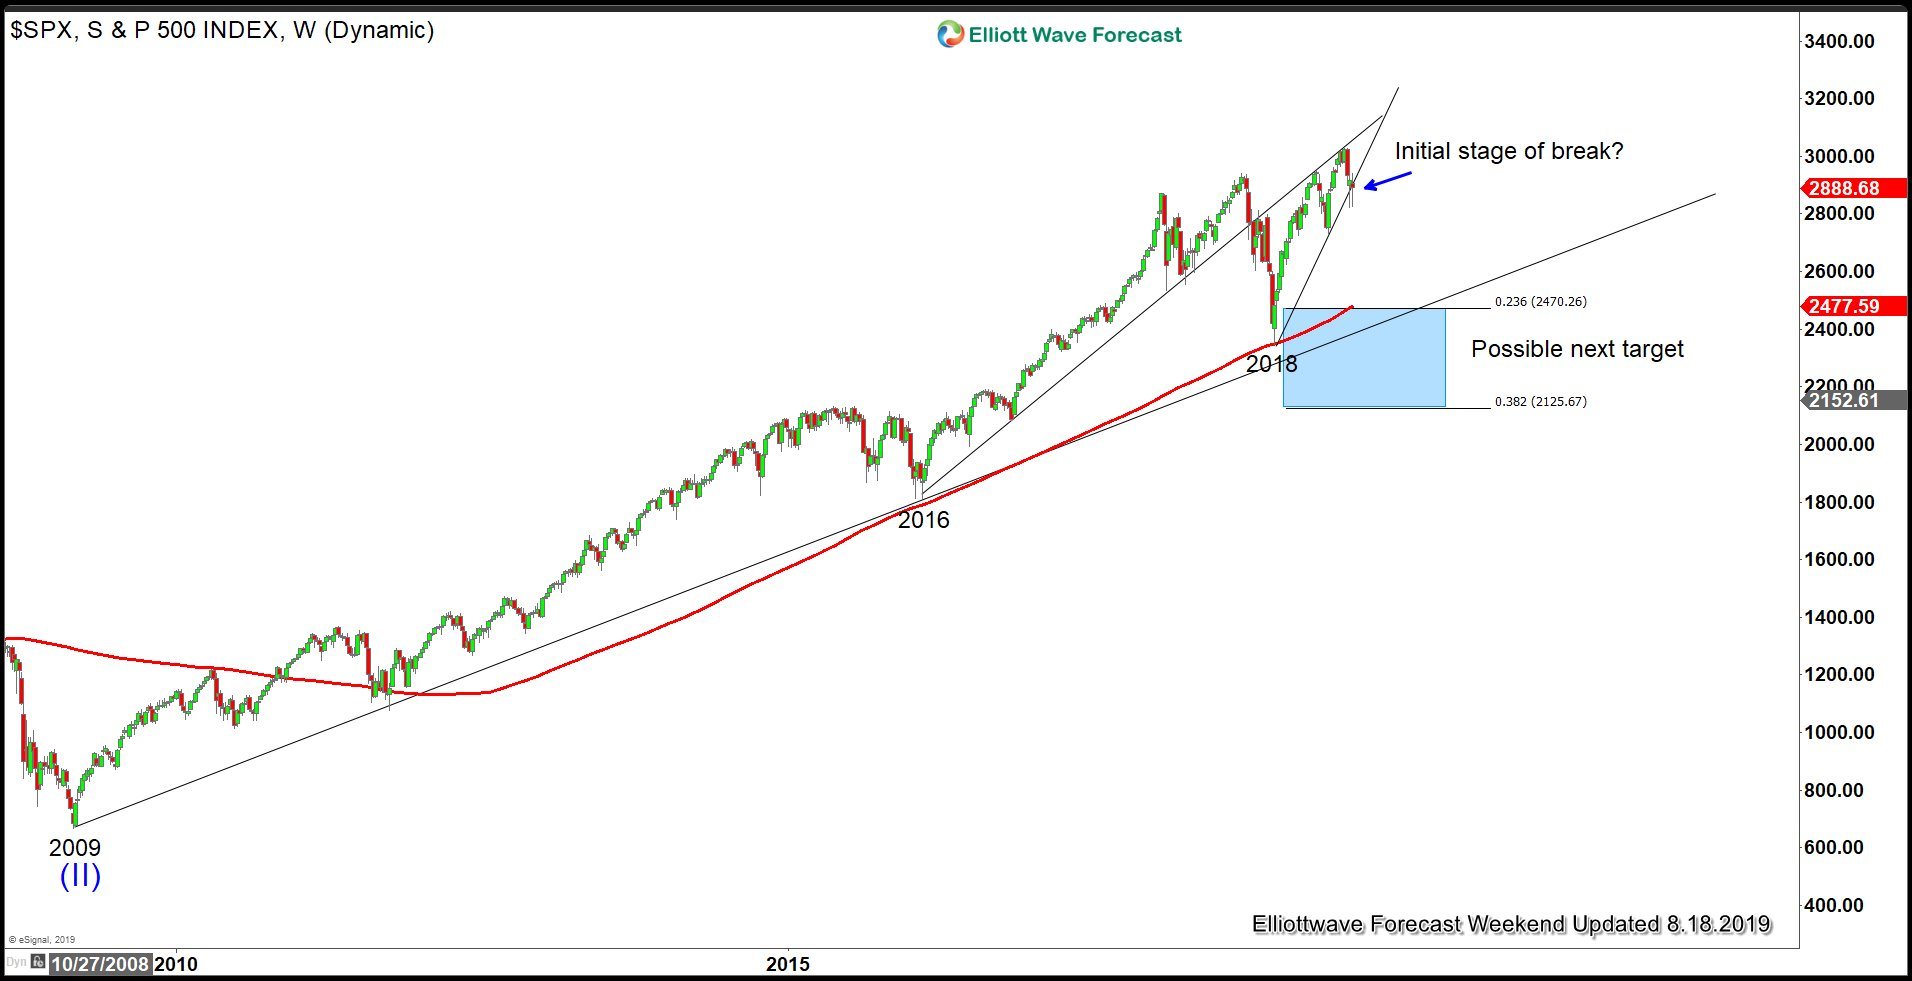
The chart above shows that the Index attempts to break the ascending trend line from 2018. If the selloff gains acceleration, then the next strong support is around 2125 – 2470. This area has the Fibonacci support of 23.6 – 38.2 retracement. It also has the support of 200 Weekly Moving Average (the red line) as well as the ascending trend line from 2009 low.
Please keep in mind that the Index does not need to immediately break down to this level, and at this point it can still rally and make further upside. However, the chart above is one possible scenario in a wave (IV) type of pullback. From 2125 – 2470 area, the Index has a chance to do a final rally in wave (V). Alternatively, Index can do a big 3 waves bounce before turning lower again.
Get more financial insights like these -- 100% free. Just follow this link
Author

Elliott Wave Forecast Team
ElliottWave-Forecast.com


