Index is looking a little under pressure

USD INDEX
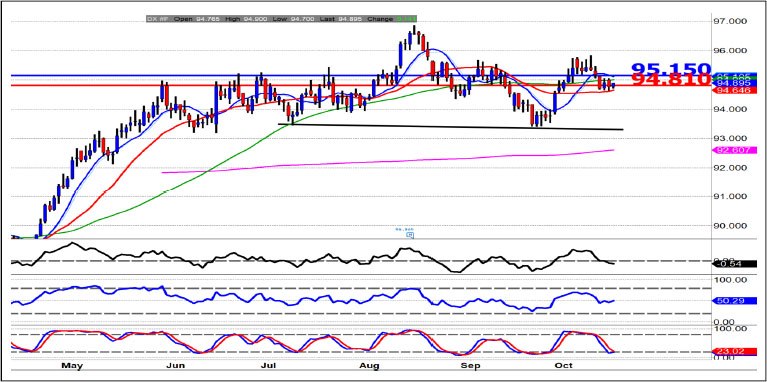
$ Index is looking a little under pressure whilst we remain below the weekly and daily pivot points....you can see these on the chart they are located at 95.15 weekly....and 94.81 daily...The only this at the moment that is holding the $Index higher is the 21 day M/A @ 94.64...intersecting with trendline support down at these lower levels...
So we are captured between the trendline and 21 day M/A and the weekly pivot and the 9 day M/A. After the rejection of 95.84 I think it did send a signal to the market that all was not well...Now I know we are oversold on the daily charts...and this may well be another thing that is keeping this market afloat...but we can go sideways to alleviate this scenario....I do believe that the $ will resume its little downward path , and a break below 94.60 would confirm...
If we do not break below this barrier we will remain in a consolidation phase...and we would be able to play the range of 94.60 to 95.15/20....
The ROC is below the 0 line...so that is not liking the market either...
You can see a bigger pattern emerging...it is a very dodgy Head and Shoulder pattern...but a pattern none the less...which is why this 94.60 is going to be so important over the next few sessions....
Author

Carol Harmer
Charmer Trading
Carol Harmer has over 39 years experience of analysing and trading the world's markets and is undoubtedly one of the most respected technical trader in the world today.


