|

Hindustan Copper’s Elliott Wave counts

Weekly Elliott Wave counts suggest the correction is nearing completion

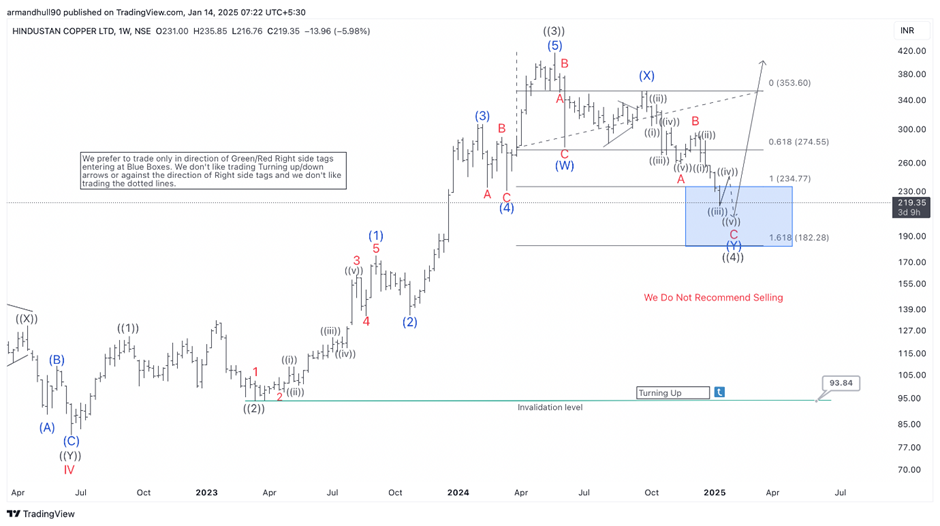
The Elliott Wave analysis for Hindustan Copper Ltd. (NSE) indicates a correction on the weekly chart. The broader structure follows a five-wave sequence, with waves ((1)) and ((3)) already completing their upward moves. Currently, wave ((4)) is unfolding as a double zigzag pattern (W-X-Y). Wave (Y) aims for the area of 1 and 1.618 Fibonacci extension of wave (W), between  234 and 182 INR.

Importantly, the analysis identifies a blue box zone, which signals a high-probability reversal area. Wave ((4)) is likely to end here, after which wave ((5)) should resume the bullish trend. This wave is expected to break above the high of wave ((3)) at 354.65 INR. However, the invalidation level lies below the blue box. If the price falls below this level, the analysis would need revision.

Chart

Daily chart: Short-term outlook

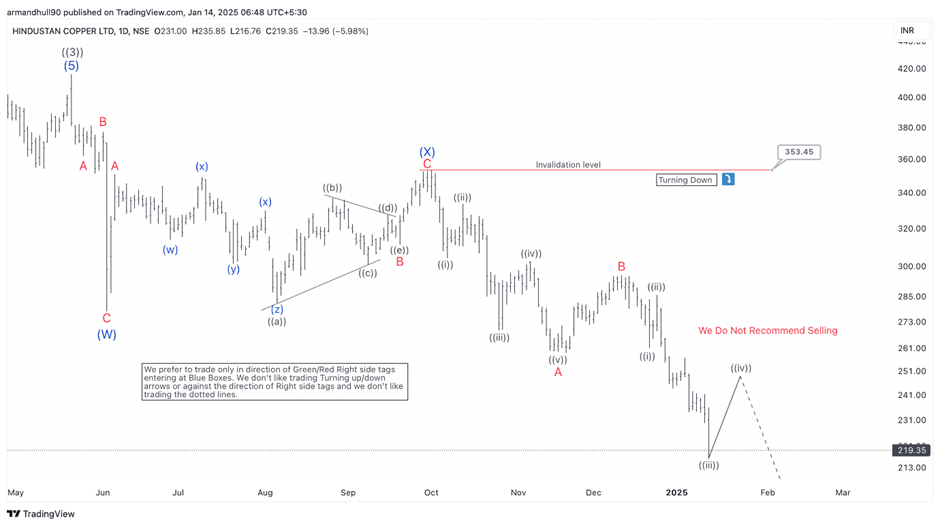
On the daily chart, wave ((4)) is visible as a detailed double zigzag (W-X-Y). The final wave (Y) is progressing as a downward five-wave move. So far, the price has reached the blue box, which aligns with Fibonacci levels between 1.0 and 1.618.

A minor rebound in wave (iv) is likely, with resistance near 250–260 INR. Afterward, wave (iii) may extend further downward, targeting an area of 234-182 INR. Traders should look for confirmation of a trend reversal in the blue box before taking long positions. This zone is crucial because it could mark the end of the correction and the start of wave ((5)).

Chart

Author

Elliott Wave Forecast Team

Elliott Wave Forecast Team

ElliottWave-Forecast.com

More from Elliott Wave Forecast Team
Share:

Editor's Picks

EUR/USD: US Dollar to remain pressured until uncertainty fog dissipates

Unimpressive European Central Bank left monetary policy unchanged for the fifth consecutive meeting. The United States first-tier employment and inflation data is scheduled for the second week of February. EUR/USD battles to remain afloat above 1.1800, sellers moving to the sidelines.

GBP/USD reclaims 1.3600 and above

GBP/USD reverses two straight days of losses, surpassing the key 1.3600 yardstick on Friday. Cable’s rebound comes as the Greenback slips away from two-week highs in response to some profit-taking mood and speculation of Fed rate cuts. In addition, hawkish comments from the BoE’s Pill are also collaborating with the quid’s improvement.

Gold: Volatility persists in commodity space

After losing more than 8% to end the previous week, Gold remained under heavy selling pressure on Monday and dropped toward $4,400. Although XAU/USD staged a decisive rebound afterward, it failed to stabilize above $5,000. The US economic calendar will feature Nonfarm Payrolls and Consumer Price Index data for January, which could influence the market pricing of the Federal Reserve’s policy outlook and impact Gold’s performance.

Week ahead: US NFP and CPI data to shake Fed cut bets, Japan election looms

US NFP and CPI data awaited after Warsh’s nomination as Fed chief. Yen traders lock gaze on Sunday’s snap election. UK and Eurozone Q4 GDP data also on the agenda. China CPI and PPI could reveal more weakness in domestic demand.

Three scenarios for Japanese Yen ahead of snap election

The latest polls point to a dominant win for the ruling bloc at the upcoming Japanese snap election. The larger Sanae Takaichi’s mandate, the more investors fear faster implementation of tax cuts and spending plans. 

XRP rally extends as modest ETF inflows support recovery

Ripple is accelerating its recovery, trading above $1.36 at the time of writing on Friday, as investors adjust their positions following a turbulent week in the broader crypto market. The remittance token is up over 21% from its intraday low of $1.12.