Gold, the Chart of the Week: XAU/USD bulls could be about to make a move
- Gold is correcting the sell-off and eyes are on what could be a restest of the spring and a subsequent rally for the opening sessions.
- A 50% mean reversion of the daily charts could be on the cards.

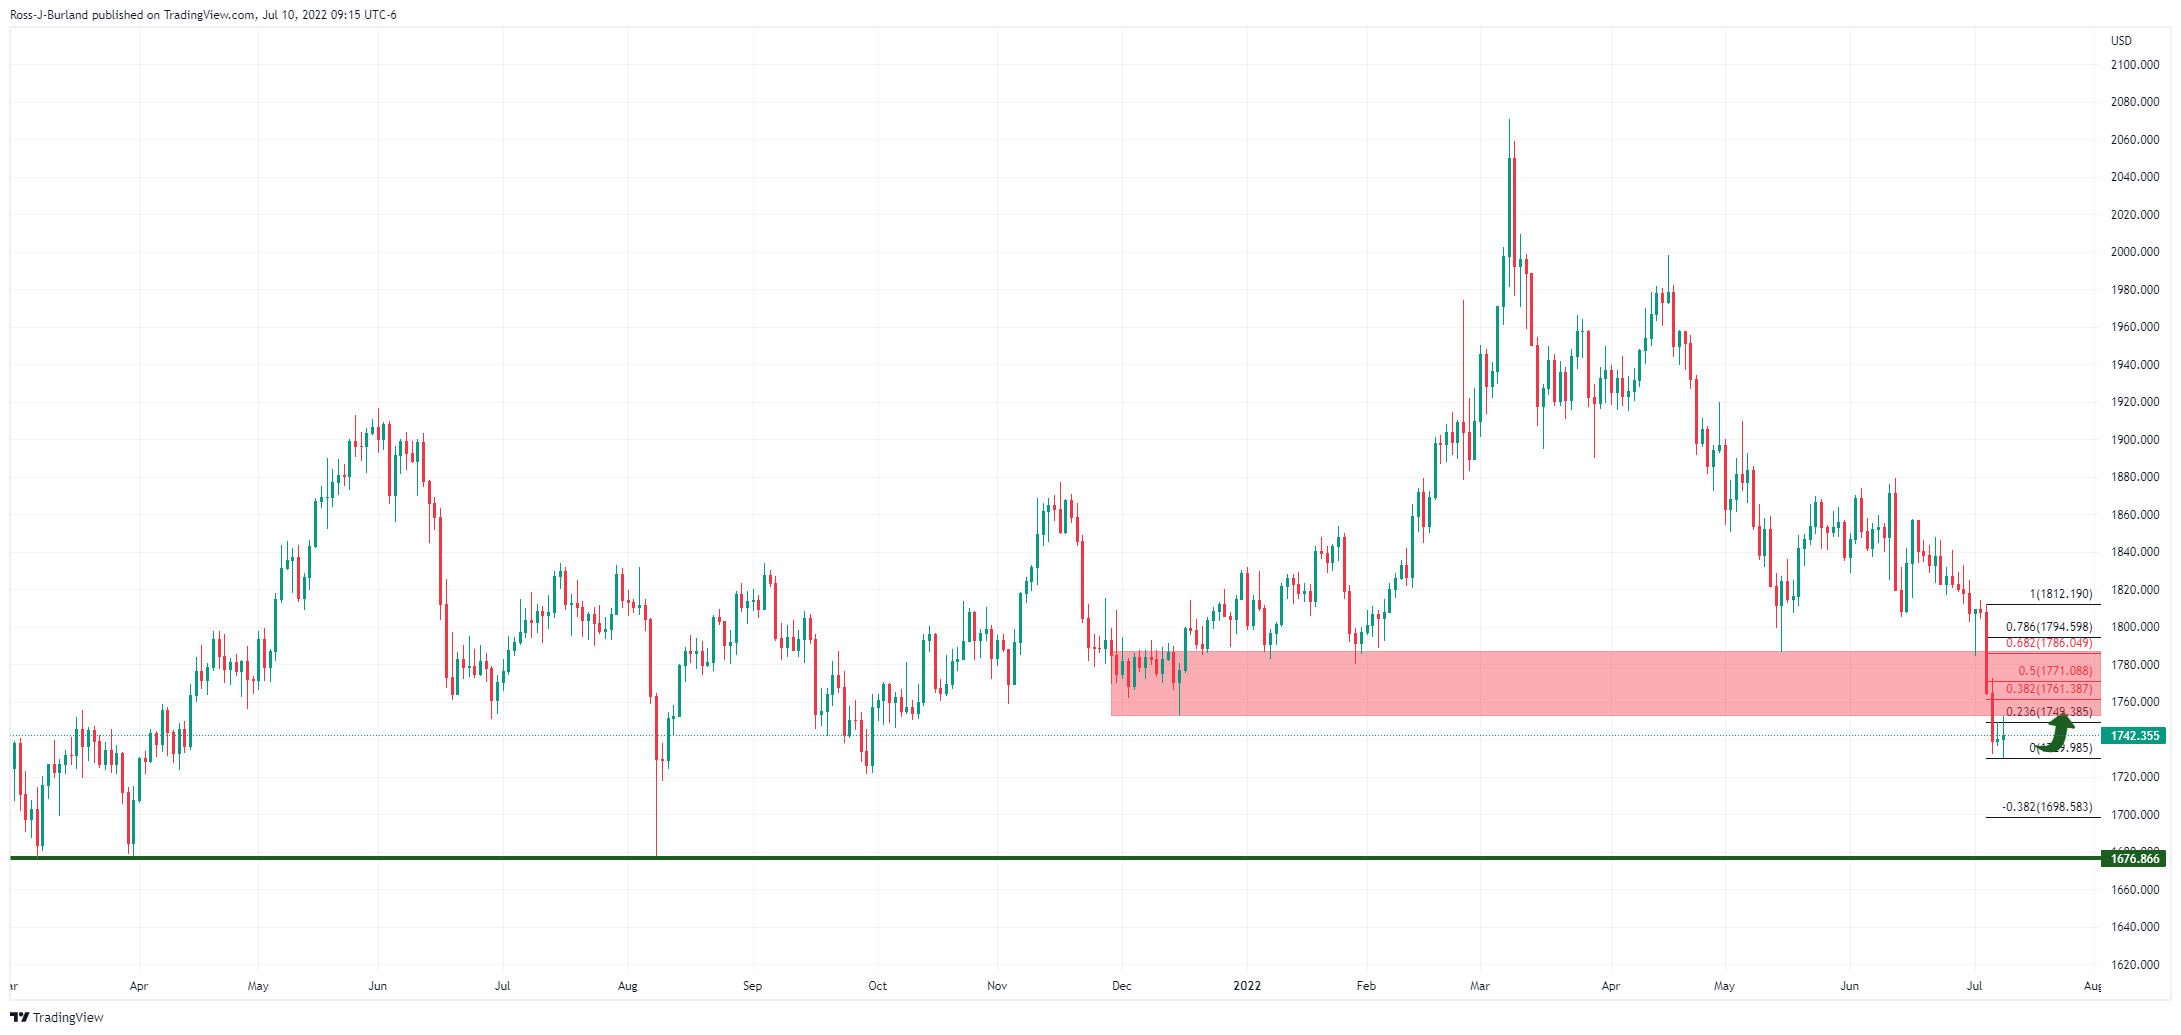
The gold price has corrected to a 23.6% Fibonacci retracement and has left two daily dojis on the charts but a stronger than expected US Services ISM and a solid US Labor report have seen the market add 14bp to end-2022 Fed Funds pricing.
This leaves the US dollar in charge and will keep pressure on gold which hovers above a fresh nine-month low as investors continue to slash their holding of the precious metal. Gold-backed ETFs have seen their holdings fall by 39t over the past week to their lowest level in almost four months.
Nevertheless, the spot market is attempting to correct both on the DXY and gold charts as follows:
Gold and DXY technical analysis
DXY monthly & daily charts
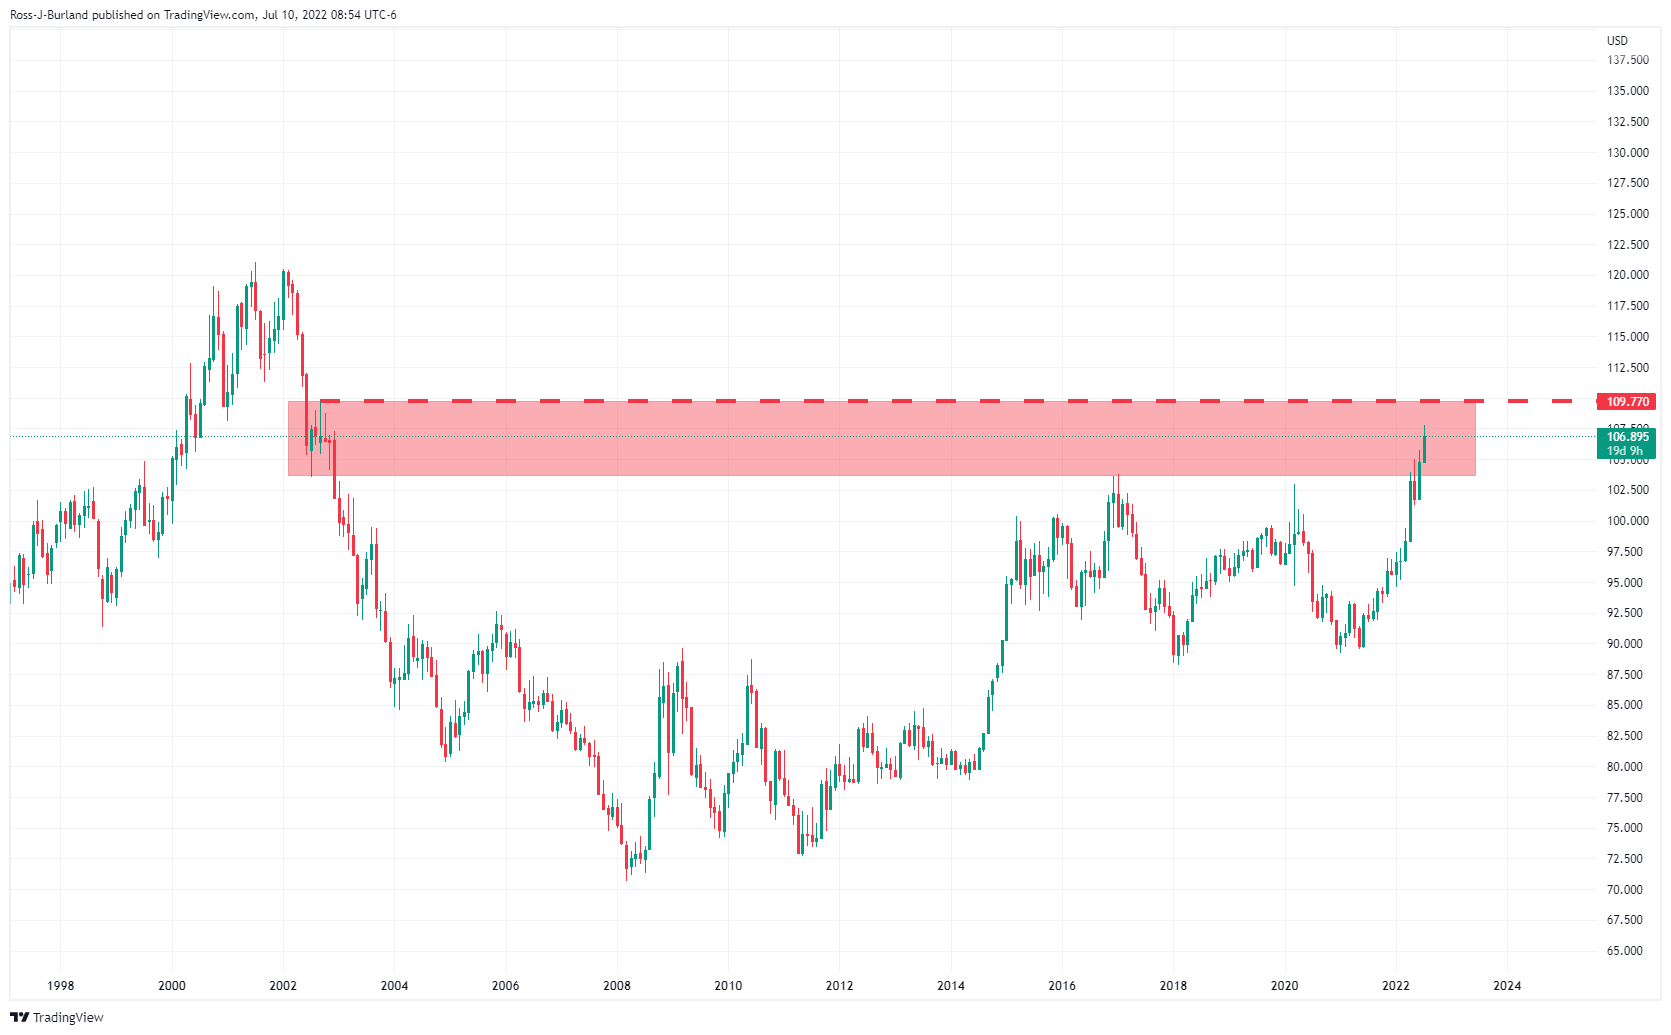
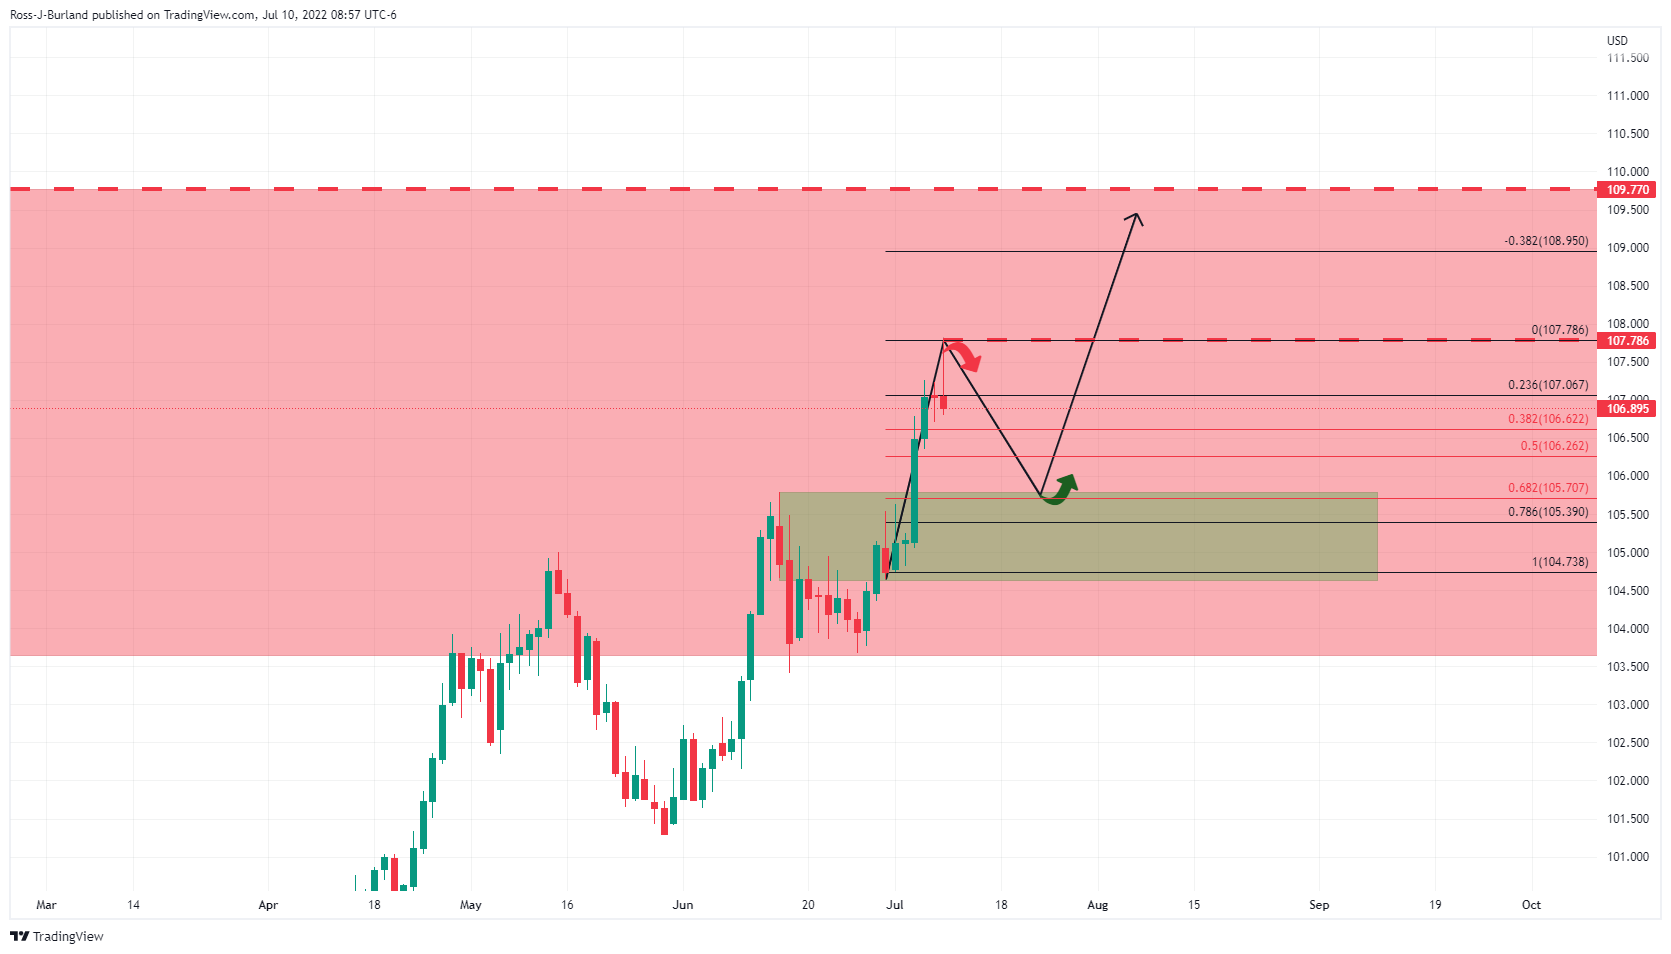
The DXY is meeting a monthly supply area that could hold off the bulls for a moment giving rise to prospects of a correction on the daily chart as it appears to top out near 107.80. A 61.8% Fibonacci retracement sits near prior swing highs near 105.70. If this were to play out, we would have had a bullish setup in gold for the week ahead.
Gold daily chart
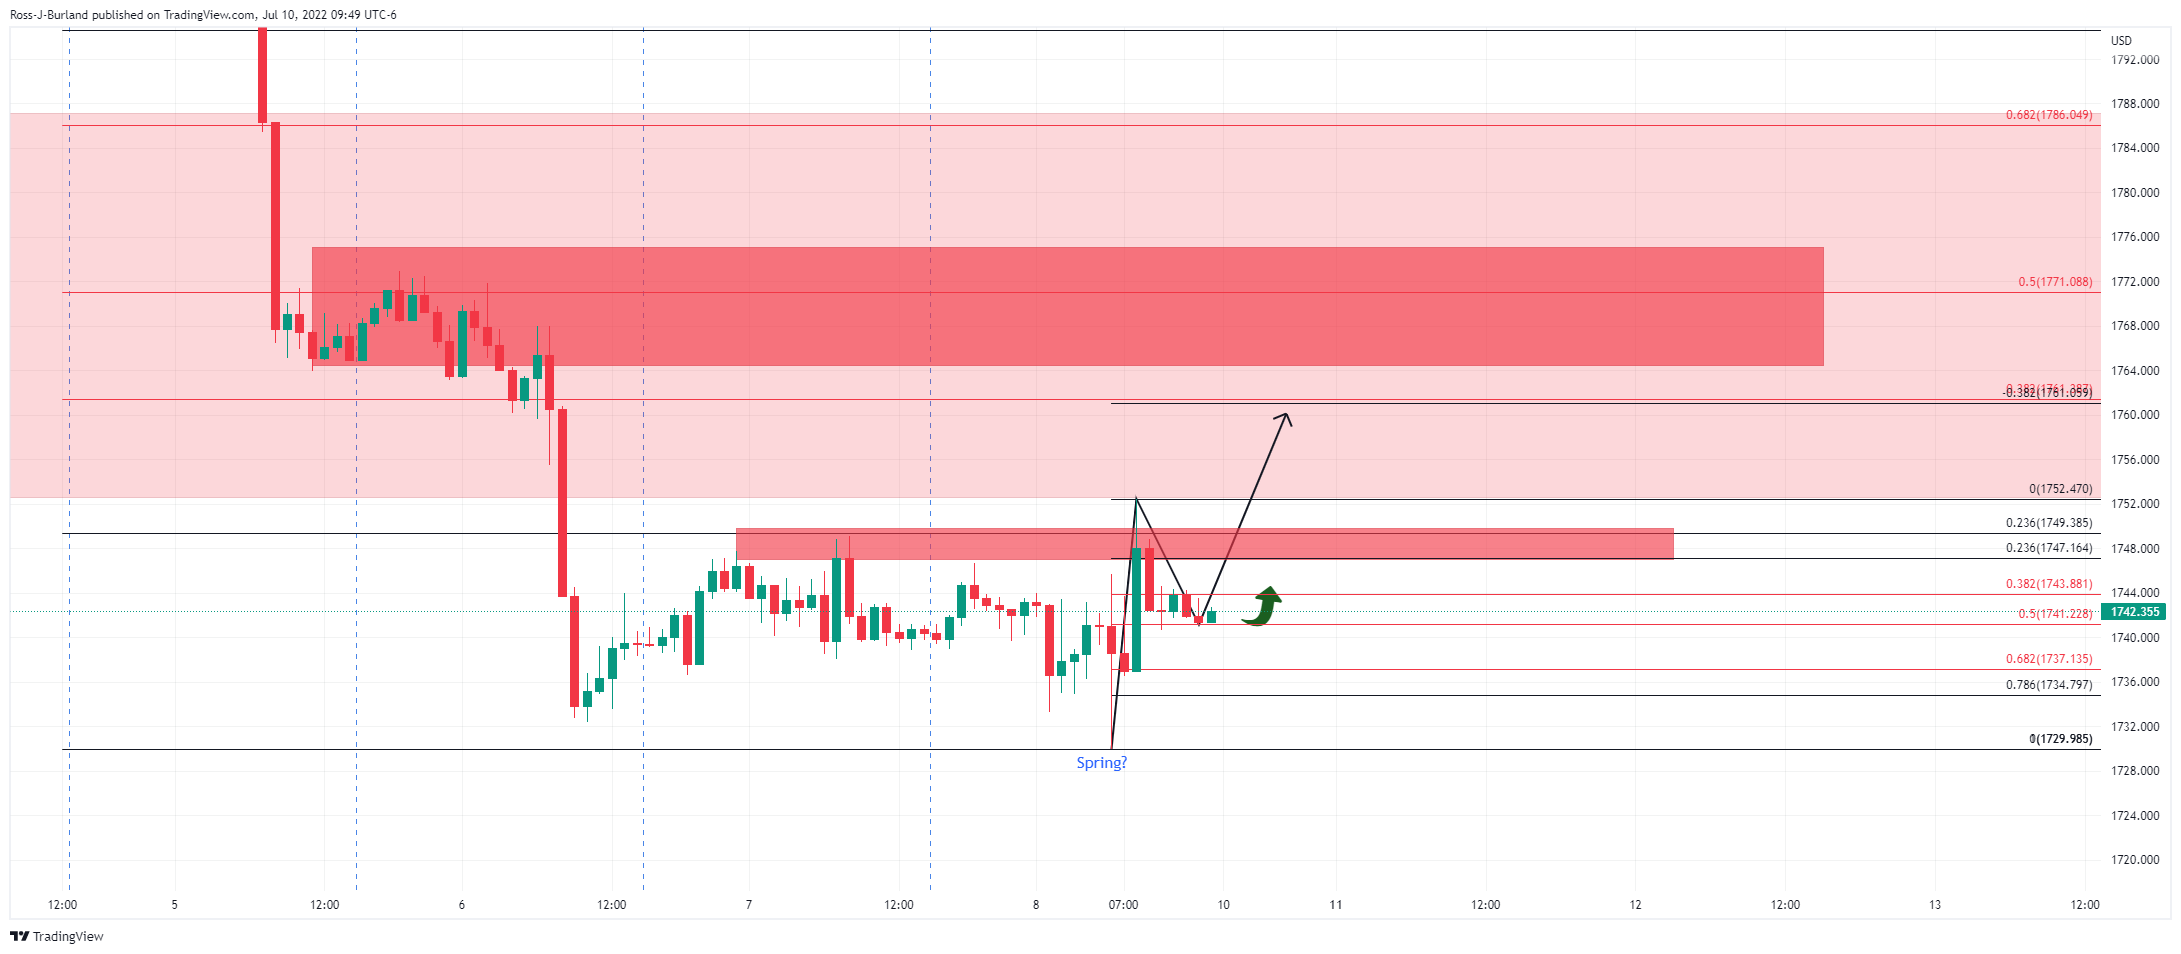
Gold, H4 &H1 charts
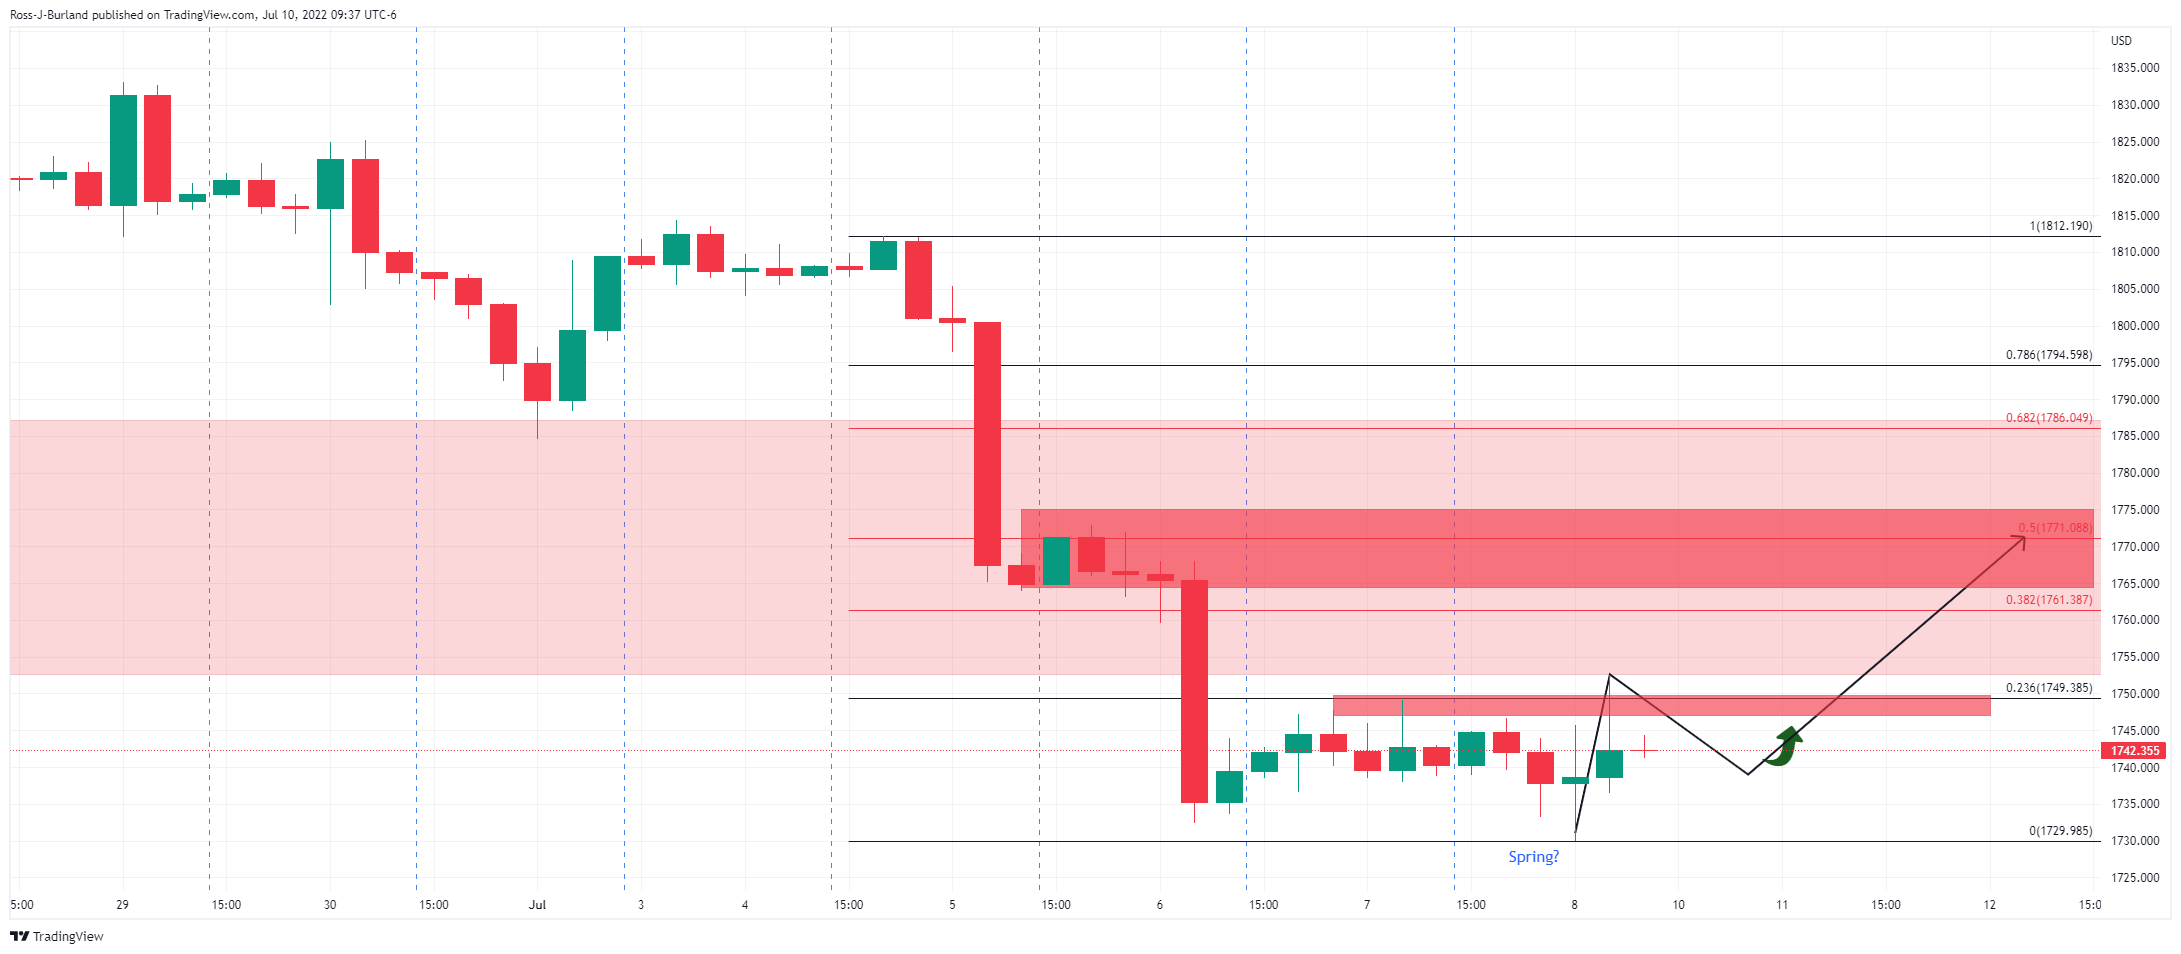
The question is whether the last low was the spring, otherwise known as the final test lower and commitments from the bulls. A break of $1,750 will be encouraging. On the hourly chart, we have seen a 50% mean reversion and retest of what could be the spring so a bullish open could set the stage for a significant bullish breakout as per the hourly chart:
Premium
You have reached your limit of 3 free articles for this month.
Start your subscription and get access to all our original articles.
Author

Ross J Burland
FXStreet
Ross J Burland, born in England, UK, is a sportsman at heart. He played Rugby and Judo for his county, Kent and the South East of England Rugby team.


