Gold Price Forecast: XAU/USD trimmed part of its latest losses, holds above $2,350

XAU/USD Current price: $2,354.27
- Gold recovered some of the ground lost last week amid persistent US Dollar interest.
- The focus this week is on the US Personal Consumption Expenditures Price Index.
- XAU/USD struggling to extend gains in the near term, still under bulls’ control.
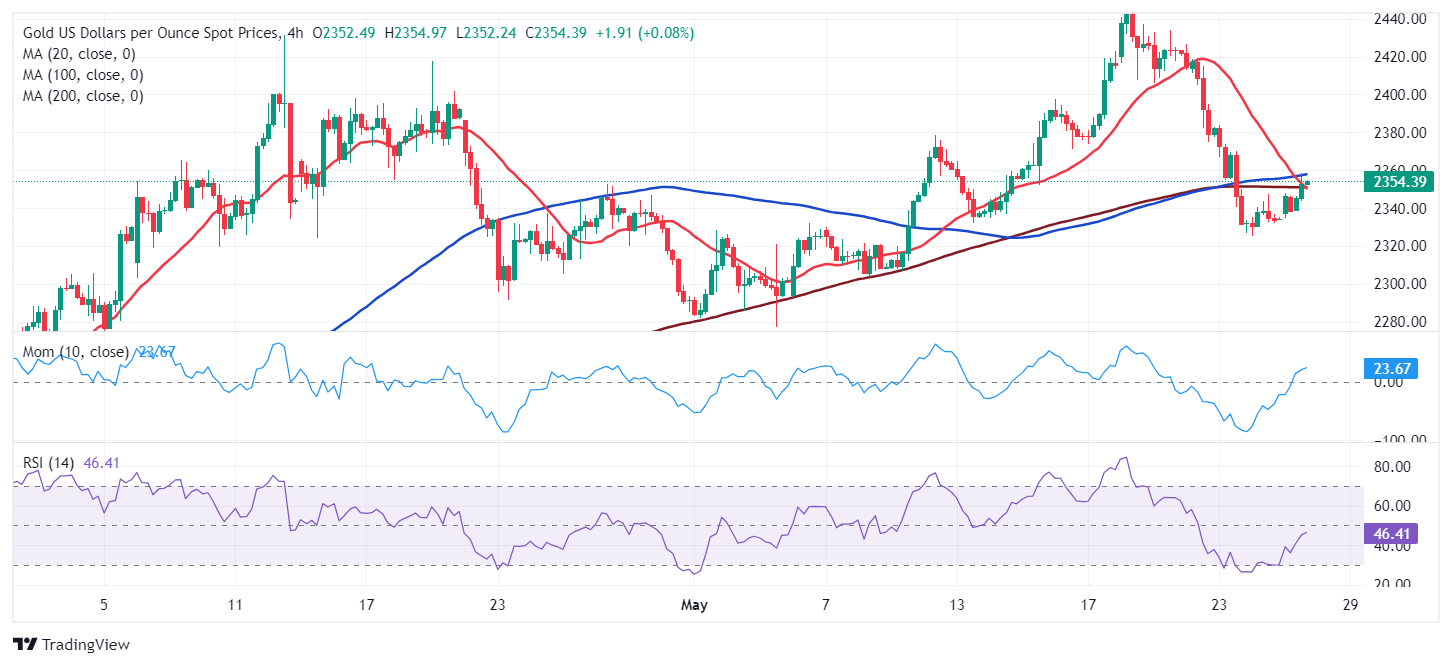
Gold prices are up on Monday, with XAU/USD trading at around $2,355 after the European close. The bright metal extended its Friday recovery when it slid $2,325.30, its lowest in two weeks. The tepid recovery was the result of the persistent weakness of the US Dollar, as investors keep pricing in no rate cuts from the Federal Reserve (Fed) in the upcoming two meetings. The recovery stalled amid the Memorial Day holiday in the United States (US), keeping local markets closed.
The US has a light macroeconomic calendar in the upcoming days, shifting the focus to Friday when the country will publish the April Personal Consumption Expenditures (PCE) Price Index, the Fed’s favorite inflation gauge. PCE inflation is foreseen to be stable at 2.7% YoY, while the core annual reading is expected to print at 2.8%, matching the March reading. Finally, the PCE Price Index is expected to have risen 0.3% MoM. Generally speaking, readings below forecast should boost the odds for a soon-to-come rate hike, while the opposite scenario will be understood as a delay in monetary tightening beyond September.
XAU/USD short-term technical outlook
From a technical point of view, the XAU/USD pair seems poised to extend its advance. The daily chart shows that tast week’s slump was enough for the pair to correct overbought conditions, and technical indicators are currently bouncing from their midlines. At the same time, the pair is recovering above a directionless 20 Simple Moving Average (SMA) while the longer moving averages accelerate their advances far below the shorter one, all of which reflects persistent buying interest.
In the near term, however, according to the 4-hour chart, the recovery stalled around a congestion of moving averages, with the 20 SMA heading firmly south and hovering around directionless longer ones. Finally, technical indicators advance, although within negative levels, falling short of supporting a continued advance.
Support levels: 2,340.20 2,325.30 2,307.10
Resistance levels: 2,358.40 2,372.90 2,384.15
Author

Valeria Bednarik
FXStreet
Valeria Bednarik was born and lives in Buenos Aires, Argentina. Her passion for math and numbers pushed her into studying economics in her younger years.

















