Gold Price Forecast: XAU/USD record highs keep coming

XAU/USD Current price: $2,628.68
- Federal Reserve officials aligned before Chair Powell’s dovish message.
- The United States will publish the August PCE Price Index this week.
- XAU/USD trades near fresh record highs, partially losing its bullish momentum but far from bearish.
Spot Gold traded as high as $2,634.74 a troy ounce on Monday, achieving yet another record high. XAU/USD currently hovers around $2,530, as the broad US Dollar weakness maintains the pair afloat. The Greenback found near-term demand throughout the first half of the day, but gains were modest, and the USD advance looked corrective.
It later suffered a setback as multiple Federal Reserve (Fed) officials publicly supported last week’s decision to trim rates by 50 basis points (bps) while hinting at more monetary loosening in the next few months. The dovish shift in policymakers’ tone did not impact Wall Street, as US indexes hover around their opening levels, not far from the highs posted last week.
Meanwhile, S&P Global released the preliminary estimates of the United States (US) September Purchasing Managers Indexes (PMIs), which showed business activity growth remained robust in the month. The Manufacturing PMI declined to 47 from the previous 47.9, missing the 48.5 anticipated by financial markets. On the other hand, the Services PMI posted 55.4, which is better than the 55.2 expected. Finally, the Composite PMI was reported at 54.4, slightly below the previous 54.6.
By the end of the week, the US will publish the August Personal Consumption Expenditures (PCE) Price Index, the Fed’s favorite inflation gauge. The data could hint at what the central bank may do next and whether aggressive rate cuts would become the norm.
XAU/USD short-term technical outlook
XAU/USD is up for a third consecutive day, and technical readings maintain the bullish case alive despite the easing momentum. The daily chart shows technical indicators are stabilizing within overbought readings while moving averages maintain their positive strength far below the current level. In fact, the 20 Simple Moving Average (SMA) stands at around $2,540, reflecting bulls’ strength in the last few weeks.
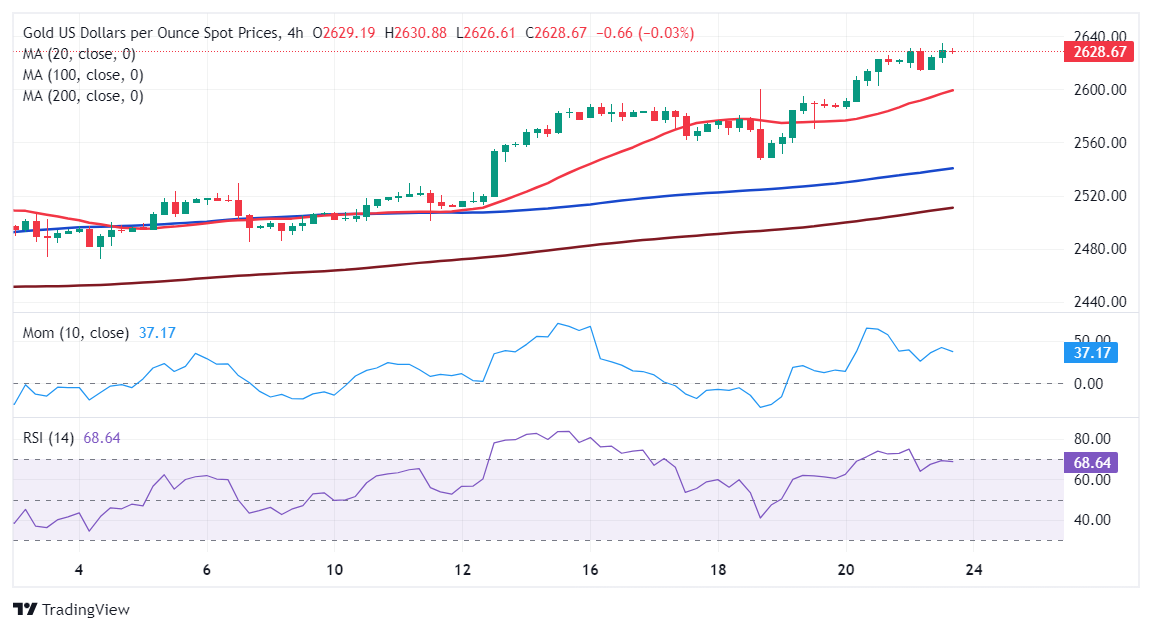
In the near term, and according to the 4-hour chart, some unconfirmed bearish divergences hint at a potential correction. Technical indicators pulled back from their recent highs with neutral-to-bearish slopes, supporting a near-term retracement. At the same time, XAU/USD keeps developing above bullish moving averages, with the 20 SMA accelerating north above the longer ones and acting as dynamic support at around $2,597.
Support levels: 2,613.50 2,698.10 2,684.60
Resistance levels: 2,635.00 2,650.00 2,675.00
Premium
You have reached your limit of 3 free articles for this month.
Start your subscription and get access to all our original articles.
Author

Valeria Bednarik
FXStreet
Valeria Bednarik was born and lives in Buenos Aires, Argentina. Her passion for math and numbers pushed her into studying economics in her younger years.


