Gold Price Forecast: XAU/USD keeps reaching record highs on Fed rate cuts bets

XAU/USD Current price: $3,639.82
- The US Dollar extended the tepid employment data-inspired slump.
- The United States will publish fresh inflation data in the upcoming days.
- XAU/USD trades near fresh all-time highs with the bullish bias intact.
Gold prices reached fresh record highs on Monday, with the bright metal extending its rally beyond the $3,630 mark. It currently trades not far below an intraday peak of $3,646.41, as investors keep dropping the US Dollar (USD). The Greenback’s selling spiral was triggered by a tepid Nonfarm Payrolls (NFP), which showed the country added a modest 22K new jobs in August. The country added 79K in July, and lost 12K in June, making it a third consecutive discouraging report.
Tepid job creation pretty much confirmed the Federal Reserve (Fed) will cut interest rates when it meets next week, with market participants even increasing bets for a larger interest rate cut of 50 basis points (bps).
During the upcoming days, the United States (US) will publish inflation-related figures. The July Producer Price Index (PPI) will be out on Wednesday, while the August Consumer Price Index (CPI) will be out on Thursday. The latter is foreseen at 2.9% YoY, higher than the 2.7% posted in July. The core annual reading is expected to remain steady at 3.1%. Also on Thursday, the European Central Bank (ECB) is scheduled to announce its decision on monetary policy. The ECB is widely anticipated to keep interest rates on hold this time.
XAU/USD short-term technical outlook
From a technical point of view, the daily chart for XAU/USD shows that bulls are in full control despite overbought conditions. Technical indicators head firmly north at extreme levels, without signs of changing course anytime soon. At the same time, the pair is developing above all its moving averages, with the 20 Simple Moving Average (SMA) gaining upward traction above the 100 and 200 SMAs.
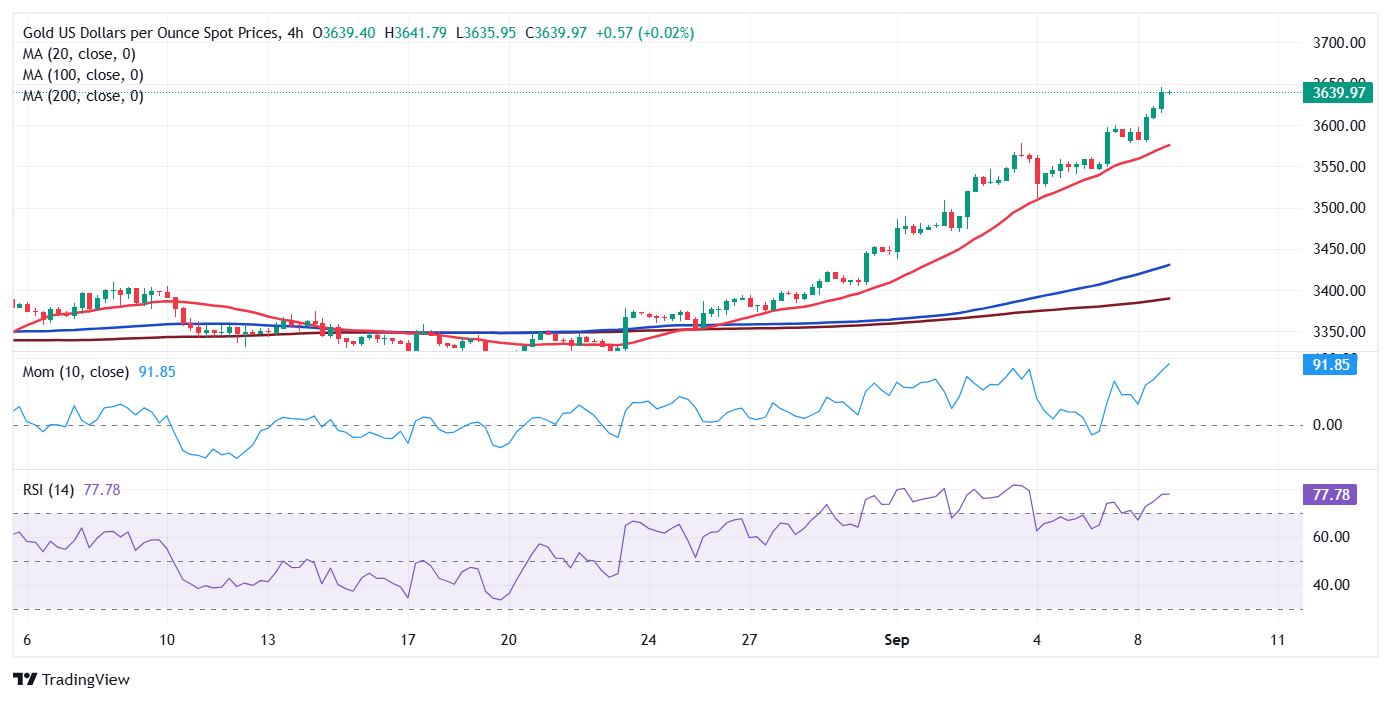
The near-term picture also skews the risk to the upside. The 4-hour chart shows that technical indicators keep heading higher within overbought readings, partially losing their upward strength but still aiming north. At the same time, a bullish 20 SMA stands at around $3,571, which is well above the longer ones, reflecting the latest run to record highs. Corrective declines should now find buyers around $3,600 for the bullish trend to remain alive.
Support levels: 3,625.85 3,608.40 3,593.70
Resistance levels: 3,650.00 3,675.00 3,690.00
Premium
You have reached your limit of 3 free articles for this month.
Start your subscription and get access to all our original articles.
Author

Valeria Bednarik
FXStreet
Valeria Bednarik was born and lives in Buenos Aires, Argentina. Her passion for math and numbers pushed her into studying economics in her younger years.


