Gold Price Forecast: XAU/USD hurt by US-China trade deal hopes; buyers still hopeful?
- Gold price opens the week on a bearish note amid US-China trade deal optimism.
- The US Dollar holds a bullish opening gap amid a generalized risk-on market profile.
- Gold price closed Friday above 21-day SMA, then at $3,307, where next?

Gold price is licking its wounds after witnessing a steep sell-off in the opening trades, sending the bright metal to its lowest level in five days near the $3,250 level.
Gold price wilts on reduced safe-haven appeal
The latest leg down in Gold price is driven by a generalized upbeat mood as investors cheer ‘'substantial progress’ touted by the United States (US) and China following their high-stakes trade talks in Geneva over the weekend.
Increased hopes that the world’s two largest economies will finally reach a trade deal after last month’s tit-for-tat tariffs on each other almost put a halt to their foreign trade. This broader market optimism has diminished Gold’s appeal as a traditional safe haven.
However, the Gold price downside appears capped, as a US-Sino joint statement on the Geneva trade talks is eagerly anticipated for fresh trading impetus.
Additionally, Gold price continues to receive support from the ongoing geopolitical tensions between India and Pakistan and Russia-Ukraine.
“The Indian military sent a "hotline message" to Pakistan on Sunday about violations of a ceasefire agreed upon this week and informed it of New Delhi's intent to respond if it was repeated, a top Indian army officer said, while the Pakistan military's spokesman denied any ceasefire violations,” according to Reuters.
Meanwhile, Ukrainian President Volodymyr Zelenskyy stated that he hopes for a full and temporary ceasefire with Russia to begin on Monday, May 12. However, Moscow effectively rejected the proposal and called for direct negotiations instead without preconditions.
Looking ahead, several key factors remain, including trade and geopolitical risks, which could continue to keep Gold sellers in check.
Markets also focus on US trade talks with Japan and the European Union (EU), which remain a cause for concern, especially after the European Commission announced last week that it plans to introduce countermeasures on up to EUR95 billion ($107.2 billion) of US imports, if negotiations with Washington were to fail to eliminate tariffs applied by US President Donald Trump, per Reuters.
Earlier on, Japanese Prime Minister Shigeru Ishiba noted that “autos, agriculture, airplane parts are all separate from security matters,” while setting out some outlines on trade negotiations.
Gold price technical analysis: Daily chart
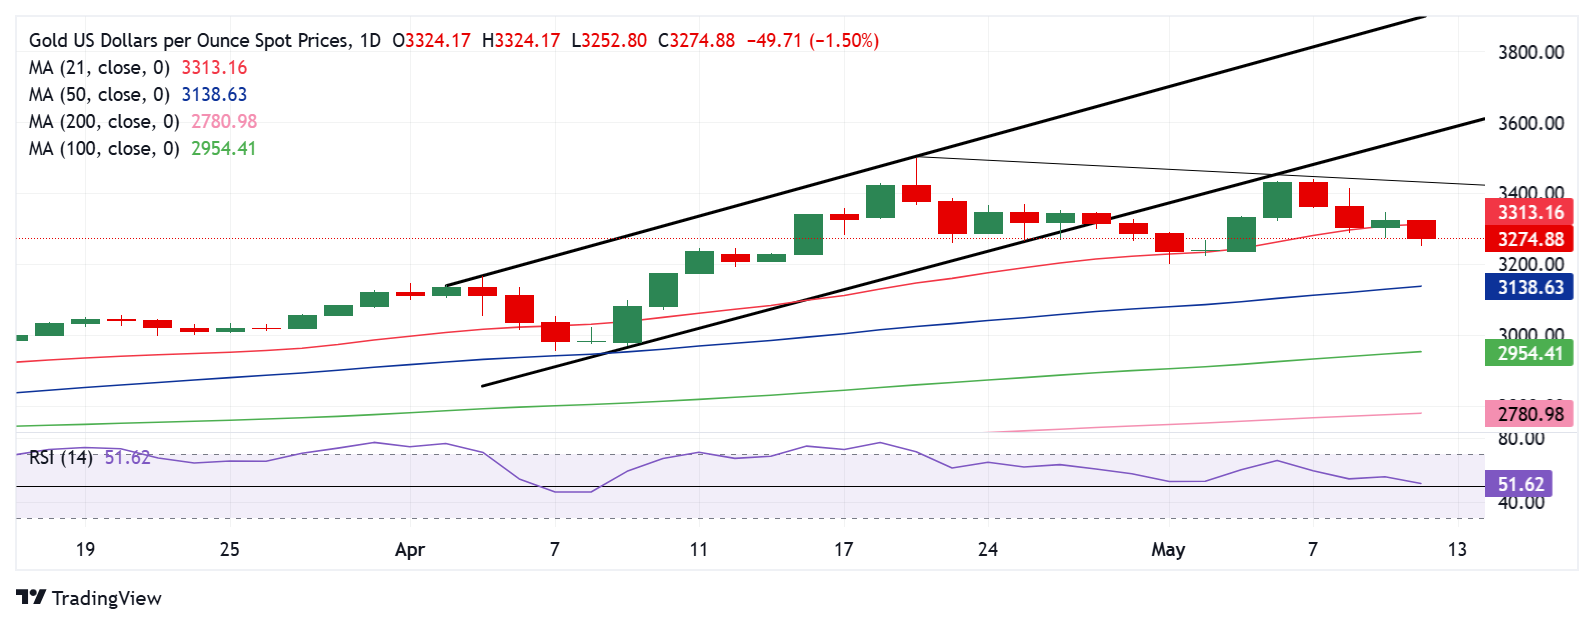
Gold price closed Friday above the 21-day Simple Moving Average (SMA), then at $3,307, keeping buyers hopeful.
However, the 14-day Relative Strength Index (RSI) appears to be on the verge of turning bearish as the leading indicator threatens the midline.
If the RSI holds the midline, a rebound toward the 21-day SMA support-turned-resistance at $3,313 will unfold. Acceptance above that level will call for a test of the falling trendline resistance at $3,433, where the intermittent resistance aligns.
A sustained move above that level will open the door toward the record high of $3,500.
Conversely, a daily candlestick closing below the 21-day SMA at $3,313 will likely negate any bullish bias in the near term, opening up a fresh downtrend toward the 50-day SMA at $3,138.
Ahead of that, the May 1 low of $3,202 will be challenged.
US-China Trade War FAQs
Generally speaking, a trade war is an economic conflict between two or more countries due to extreme protectionism on one end. It implies the creation of trade barriers, such as tariffs, which result in counter-barriers, escalating import costs, and hence the cost of living.
An economic conflict between the United States (US) and China began early in 2018, when President Donald Trump set trade barriers on China, claiming unfair commercial practices and intellectual property theft from the Asian giant. China took retaliatory action, imposing tariffs on multiple US goods, such as automobiles and soybeans. Tensions escalated until the two countries signed the US-China Phase One trade deal in January 2020. The agreement required structural reforms and other changes to China’s economic and trade regime and pretended to restore stability and trust between the two nations. However, the Coronavirus pandemic took the focus out of the conflict. Yet, it is worth mentioning that President Joe Biden, who took office after Trump, kept tariffs in place and even added some additional levies.
The return of Donald Trump to the White House as the 47th US President has sparked a fresh wave of tensions between the two countries. During the 2024 election campaign, Trump pledged to impose 60% tariffs on China once he returned to office, which he did on January 20, 2025. With Trump back, the US-China trade war is meant to resume where it was left, with tit-for-tat policies affecting the global economic landscape amid disruptions in global supply chains, resulting in a reduction in spending, particularly investment, and directly feeding into the Consumer Price Index inflation.
Premium
You have reached your limit of 3 free articles for this month.
Start your subscription and get access to all our original articles.
Author

Dhwani Mehta
FXStreet
Residing in Mumbai (India), Dhwani is a Senior Analyst and Manager of the Asian session at FXStreet. She has over 10 years of experience in analyzing and covering the global financial markets, with specialization in Forex and commodities markets.


