Gold Price Forecast: XAU/USD finds buyers around $3,300

XAU/USD Current price: $3,312.61
- Easing concerns about the Middle East crisis undermined demand for Gold.
- A hawkish US Federal Reserve Chairman adds to the risk-on mood.
- XAU/USD bounced from sub-$3,300, a near-term bottom not yet confirmed.
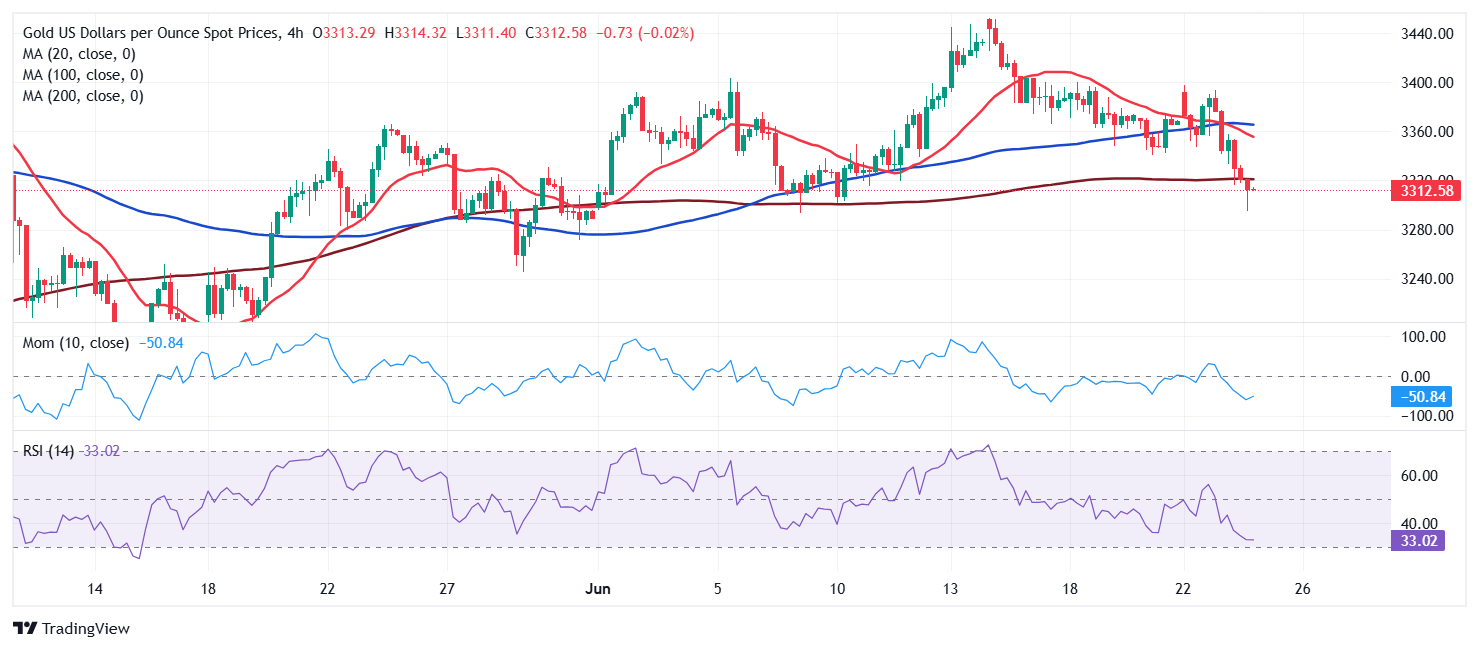
Spot Gold is depressed, barely holding above the $3,300 threshold. The XAU/USD pair is sharply down for a second consecutive day amid optimistic headlines flooding the news feeds.
On the one hand, United States (US) President Donald Trump announced a ceasefire between Iran and Israel late on Monday, with the fragile truce still spurring risk appetite. Recent headlines indicate that Israeli Prime Minister Benjamin Netanyahu agreed to the ceasefire because his country had achieved all of its war goals. Also, Iranian President Masoud Pezeshkian said that Tehran would not violate the ceasefire deal unless Israel does.
Other than that, Federal Reserve (Fed) Chair Jerome Powell testified on monetary policy before Congress. In his prepared remarks, Powell reiterated that Fed officials are concerned about the impact of tariffs on the economy and, hence, expect inflation to tick north. He also repeated that uncertainty is high, while adding that the US is not in recession. His message was tilted to hawkish, helping the market’s mood to remain upbeat and safe-haven assets under selling pressure.
XAU/USD short-term technical outlook
Technically, the XAU/USD pair's daily chart hints at additional slides, particularly if the pair breaks below the intraday low set at $3,295.46. The mentioned chart shows the pair develops below a now flat 20 Simple Moving Average (SMA), providing resistance at around $3,352. At the same time, technical indicators crossed their midlines into negative territory, maintaining their downward slopes and hinting at lower lows ahead. It is worth noting that the long-term moving averages maintain their sharp bullish slopes below the current level, limiting the case for a steeper slide below the $3,000 mark.
The 4-hour chart for XAU/USD suggests sellers have temporarily paused. The Relative Strength Index (RSI) indicator lost its bearish strength after reaching oversold readings, while the Momentum indicator turned flat below its 100 line. Still, the pair develops below all its moving averages, with a bearish 20 SMA extending its slide below a flat 100 SMA, usually indicating solid selling interest.
Support levels: 3,295.45 3,279.20 3,26490
Resistance levels: 3,328.80 3,352.00 3,374.45
Author

Valeria Bednarik
FXStreet
Valeria Bednarik was born and lives in Buenos Aires, Argentina. Her passion for math and numbers pushed her into studying economics in her younger years.