Gold Price Forecast: XAU/USD eyes acceptance above $2,670 resistance ahead of US inflation test
- Gold price consolidates the previous rebound above $2,660 early Tuesday.
- The US Dollar catches fresh haven demand while US Treasury bond yields stall recovery.
- Daily RSI recaptures 50 as Gold price eyes acceptance above 50-day SMA ahead of US CPI.

Gold's price builds on the previous rebound near $2,670 in Tuesday’s Asian trades even as the US Dollar (USD) sticks to its recovery mode, awaiting US Consumer Price Index (CPI) data on Wednesday for fresh directional impetus.
Gold price capitalizes on geopolitics and China optimism
Gold price takes advantage of a pause in the US Treasury yields upswing and expectations of more stimulus coming from China following weak inflation data on Monday. China’s CPI missed expectations in November, rising by 0.2% year on year (YoY), down from a 0.3% increase in October.
Additionally, rising Middle East geopolitical tensions, in the face of the sudden collapse of the Syrian government over the weekend, keep the haven demand for Gold price alive and kicking. Syrian rebels seized the capital, Damascus, ousting President Bashar al-Assad, who fled to Russia with his family seeking asylum.
According to Bloomberg, the leader of the Syrian rebel group, Mohammed Al Bashir, is set to form a transitional administration to "avoid slipping into chaos".
On Monday, Gold price staged a decent comeback from eight-day lows of $2,613 as Middle East geopolitical tensions offset the renewed upside in the US Dollar and the US Treasury bond yields across the curve. US Treasury bond yields rebound was led by the anticipation of stubbornly high US inflation data, which could ramp up expectations for a hawkish interest rate cut by the US Federal Reserve (Fed) next week.
Markets see an 86% probability of the Fed lowering rates by 25 basis points (bps) next week. Meanwhile, for the January Fed meeting, the odds for another 25 bps rate cut stand at about 22%, the CME Group’s FedWatch Tool shows.
Looking ahead, all eyes remain on Wednesday’s key US inflation test as Gold price could see additional profit-taking following last week’s decline. Traders will likely resort to repositioning in the lead-up to the US CPI showdown.
Meanwhile, geopolitical developments will also be closely eyed in the absence of any top-tier US economic data due later this Tuesday.
Gold price technical analysis: Daily chart
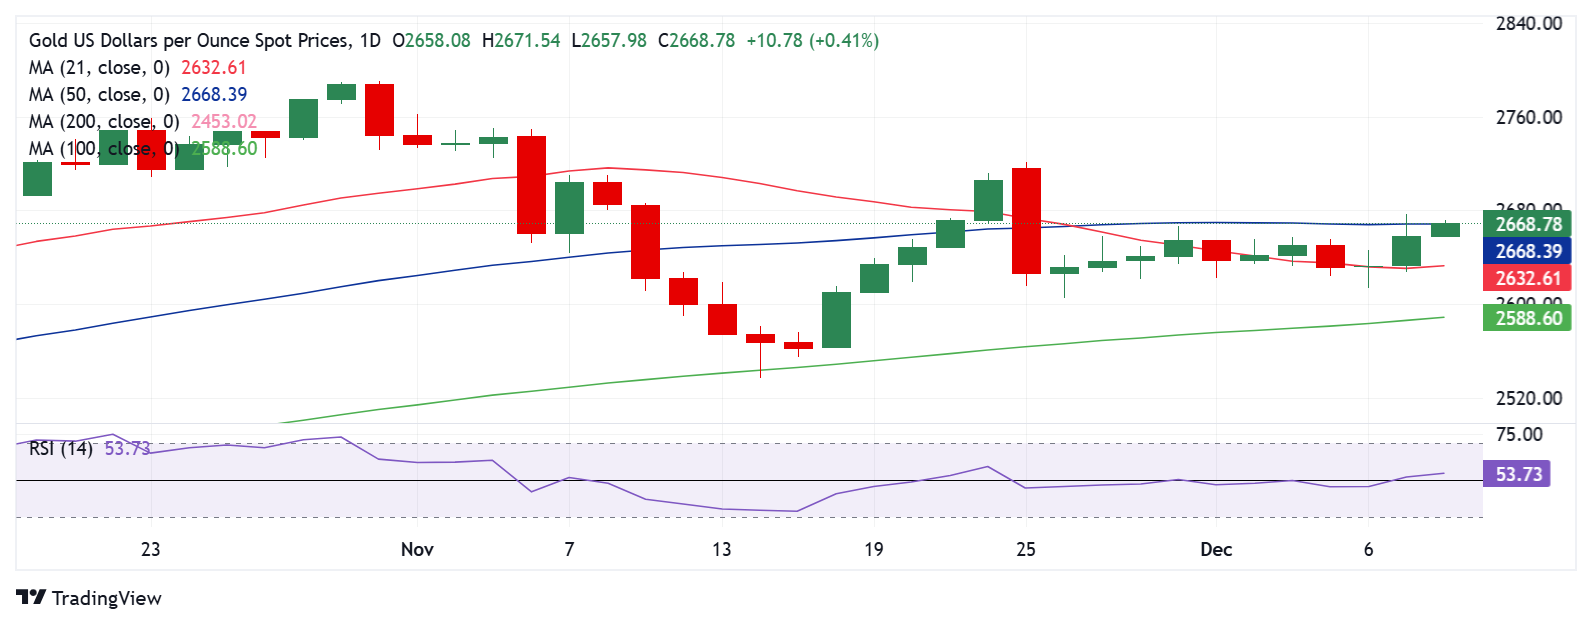
The daily chart shows that the tide has turned in favor of the Gold price as the 14-day Relative Strength Index (RSI) pierced through the midline for the upside.
Gold price is now attempting to break the recent range to the north, battling with the key 50-day Simple Moving Average (SMA) at $2,668.
Acceptance above the latter on a daily closing basis is critical for providing extra legs to the ongoing Gold price recovery.
The next relevant resistance levels are seen at the $2,700 round level and the November 25 high of $2,721.
Conversely, the 21-day SMA at $2,633 will offer strong support to buyers in case the upside loses momentum.
The previous week’s low of $2,613 will be next on sellers’ radars, below which the 100-day SMA at $2,588 will be threatened.
Gold FAQs
Gold has played a key role in human’s history as it has been widely used as a store of value and medium of exchange. Currently, apart from its shine and usage for jewelry, the precious metal is widely seen as a safe-haven asset, meaning that it is considered a good investment during turbulent times. Gold is also widely seen as a hedge against inflation and against depreciating currencies as it doesn’t rely on any specific issuer or government.
Central banks are the biggest Gold holders. In their aim to support their currencies in turbulent times, central banks tend to diversify their reserves and buy Gold to improve the perceived strength of the economy and the currency. High Gold reserves can be a source of trust for a country’s solvency. Central banks added 1,136 tonnes of Gold worth around $70 billion to their reserves in 2022, according to data from the World Gold Council. This is the highest yearly purchase since records began. Central banks from emerging economies such as China, India and Turkey are quickly increasing their Gold reserves.
Gold has an inverse correlation with the US Dollar and US Treasuries, which are both major reserve and safe-haven assets. When the Dollar depreciates, Gold tends to rise, enabling investors and central banks to diversify their assets in turbulent times. Gold is also inversely correlated with risk assets. A rally in the stock market tends to weaken Gold price, while sell-offs in riskier markets tend to favor the precious metal.
The price can move due to a wide range of factors. Geopolitical instability or fears of a deep recession can quickly make Gold price escalate due to its safe-haven status. As a yield-less asset, Gold tends to rise with lower interest rates, while higher cost of money usually weighs down on the yellow metal. Still, most moves depend on how the US Dollar (USD) behaves as the asset is priced in dollars (XAU/USD). A strong Dollar tends to keep the price of Gold controlled, whereas a weaker Dollar is likely to push Gold prices up.
Author

Dhwani Mehta
FXStreet
Residing in Mumbai (India), Dhwani is a Senior Analyst and Manager of the Asian session at FXStreet. She has over 10 years of experience in analyzing and covering the global financial markets, with specialization in Forex and commodities markets.


