Gold Price Forecast: XAU/USD consolidates near fresh weekly lows

XAU/USD Current price: $3,369.70
- The Bank of England kept the benchmark rate at 4.25% as widely anticipated.
- The Middle East crisis keeps escalating and undermining the market’s mood.
- XAU/USD is neutral-to-bearish in the near term, steeper decline out of the table.
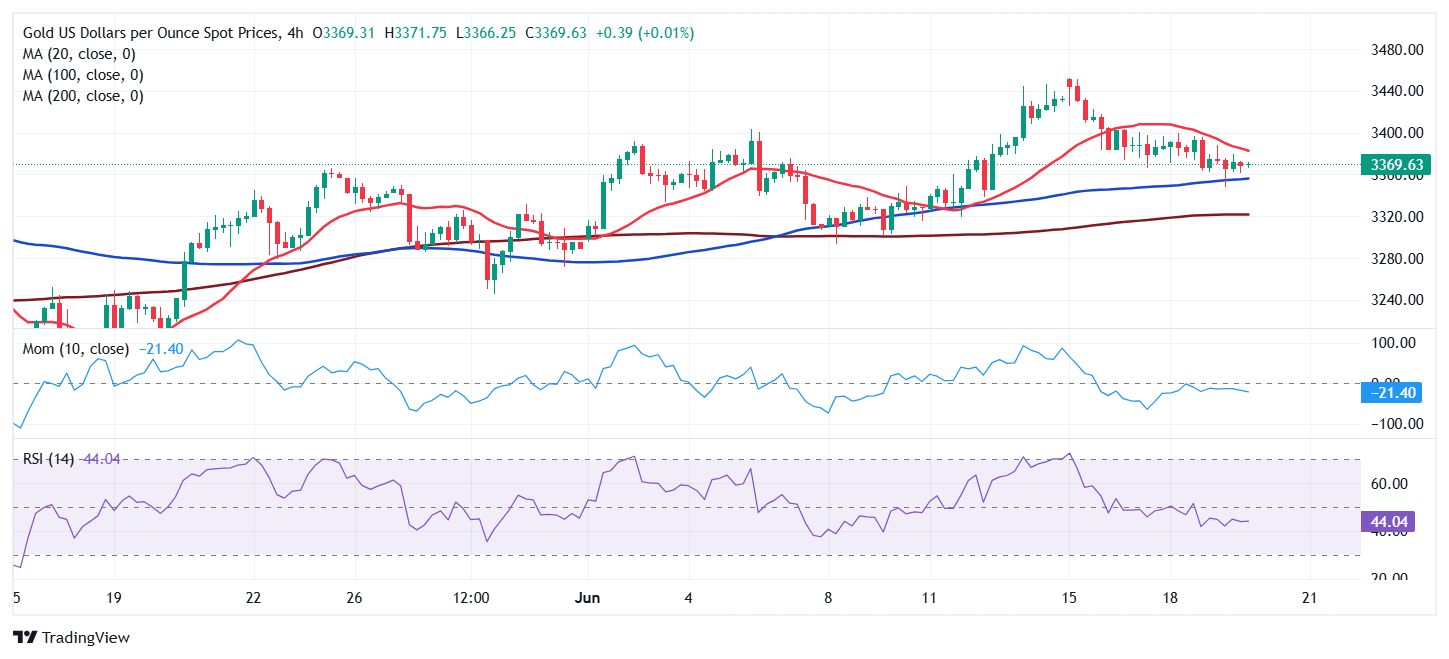
Spot Gold is depressed, trading in the $3,370 region after posting a fresh weekly low of $3,347.64 during European trading hours. The US Dollar gained ground after the United States (US) Federal Reserve (Fed) decided to keep its benchmark interest rate on hold after its June meeting. The Fed statement and Chairman Jerome Powell's press conference, however, had a hawkish tilt that surprised investors.
Mainly, market players welcome Powell’s confidence on the economy resilience, and the fact that policymakers seemed less concerns about the potential impact of US President Donald Trump tariffs.
However, Middle East tensions retook centre stage as missile exchanges between Iran and Israel intensified. Additionally, President Trump is said to have approved attack plans on Iran on Tuesday, but held back in the hopes that Tehran agrees to abandon its nuclear program.
Other than that, the Bank of England (BoE) decided to keep interest rates on hold at 4.25% early on Thursday as expected. The announcement failed to trigger relevant market moves, but put mild pressure on the Sterling Pound (GBP).
XAU/USD short-term technical outlook
The daily chart for the XAU/USD pair shows it stands at around its opening, having met buyers around a now flat 20 Simple Moving Average (SMA), currently at around $3,347. The same chart shows the 100 and 200 SMAs maintain their strong upward momentum far below the shorter one, in line with the long-term bullish trend. Finally, technical indicators stand directionless within positive levels, reflecting the lack of interest.
The near-term picture is neutral-to-bearish. The pair holds above mildly bullish 100 and 200 SMAs, while the 20 SMA gains downward momentum above the current level. At the same time, technical indicators see-saw right below their midlines, favoring another leg lower without confirming it yet.
Support levels: 3,366.10 3,347.45 3,332.10
Resistance levels: 3,385.20 3,406.90 3,414.60
Author

Valeria Bednarik
FXStreet
Valeria Bednarik was born and lives in Buenos Aires, Argentina. Her passion for math and numbers pushed her into studying economics in her younger years.