Gold Price Forecast: Is the tide turning in favor of XAU/USD sellers?
- Gold price jumped to a two-week high of $2,721 before correcting sharply on Monday.
- Fading political and geopolitical risks outweigh falling US Dollar and Treasury bonds, weighing on Gold price.
- Gold price spots an impending Bear Cross on the daily chart as the RSI stalls its bullish momentum.

After witnessing intense volatility in Monday's opening hour, Gold's price is licking its wounds near $2,700. The bright metal enjoyed good two-way trades before sellers returned to the game after five straight days.
Gold price sellers look to extend control
Gold price picked up fresh bids and jumped to nearly a two-week high of $2,721 in the early dealing. The US Dollar saw a bearish opening gap in tandem with the US Treasury bond yields. Asian traders hit their desks and reacted to the weekend news that US President-elect Donald Trump named billionaire Scott Bessent as his Treasury Secretary.
Bessent’s appointment to the critical position in the Trump administration assured the US Treasury market, as he is seen as an old Wall Street hand and a fiscal conservative. This narrative triggered a sharp retracement in the benchmark US 10-year Treasury bond yields, testing the 4.30% level as of writing.
The US Dollar (USD) tracked the sell-off in the US Treasury bond yields, currently trading 0.65% lower on the day against its major currency rivals.
Despite the ongoing pullback in the USD and the Treasury bond yields, the non-yielding Gold price cannot capitalize on it, correcting sharply from higher levels.
The latest downtick in Gold price could be attributed to improving risk sentiment, courtesy of easing geopolitical tensions between Israel and Lebanon, and reducing uncertainty around the Trump administration. Citing Israeli and US officials. Axios reported that Israel and Lebanon are on the cusp of a ceasefire agreement.
Gold buyers are also cashing in ahead of Wednesday’s US inflation data amid a holiday-shortened Thanksgiving week.
All eyes remain on the geopolitical developments between Israel and Lebanon and Russia-Ukraine in the absence of any top-tier US economic data release on Monday. No speeches from US Federal Reserve (Fed) policymakers could leave Gold traders at the mercy of risk trends.
Gold price technical analysis: Daily chart
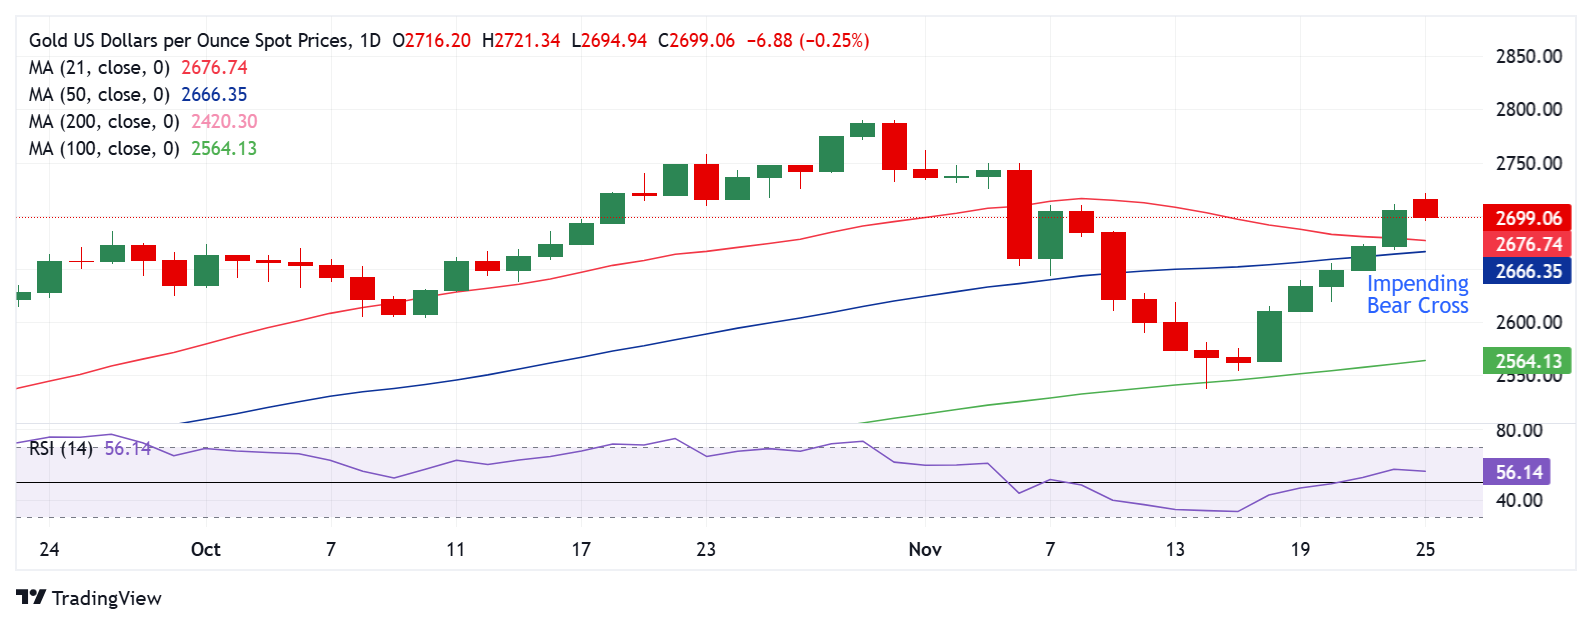
Having reclaimed all major daily Simple Moving Averages (SMA) on Friday, Gold price has paused its recovery momentum near $2,720.
The turn lower in the 14-day Relative Strength Index (RSI) could also be linked to the renewed weakness in Gold price. The leading indicator currently trades near 56 after testing the 58 level.
An impending Bear Cross continues to pose as a headwind for Gold price. The 21-day SMA is closing in to cut the 50-day SMA from above. If that happens on a daily closing basis, it will validate the bearish crossover.
These technical indicators suggest that the tide could be turning in favor of Gold sellers.
The immediate support is around $2,670, where the 21-day SMA and the 50-day SMA close in.
A sustained break below that level could initiate a fresh downtrend toward $2,600. The November 20 low of $2,619 will be tested ahead of that.
On the other hand, Gold buyers need a daily candlestick closing above the November 5 high of $2.750 to resume the uptrend toward the all-time high of $2,790.
Gold FAQs
Gold has played a key role in human’s history as it has been widely used as a store of value and medium of exchange. Currently, apart from its shine and usage for jewelry, the precious metal is widely seen as a safe-haven asset, meaning that it is considered a good investment during turbulent times. Gold is also widely seen as a hedge against inflation and against depreciating currencies as it doesn’t rely on any specific issuer or government.
Central banks are the biggest Gold holders. In their aim to support their currencies in turbulent times, central banks tend to diversify their reserves and buy Gold to improve the perceived strength of the economy and the currency. High Gold reserves can be a source of trust for a country’s solvency. Central banks added 1,136 tonnes of Gold worth around $70 billion to their reserves in 2022, according to data from the World Gold Council. This is the highest yearly purchase since records began. Central banks from emerging economies such as China, India and Turkey are quickly increasing their Gold reserves.
Gold has an inverse correlation with the US Dollar and US Treasuries, which are both major reserve and safe-haven assets. When the Dollar depreciates, Gold tends to rise, enabling investors and central banks to diversify their assets in turbulent times. Gold is also inversely correlated with risk assets. A rally in the stock market tends to weaken Gold price, while sell-offs in riskier markets tend to favor the precious metal.
The price can move due to a wide range of factors. Geopolitical instability or fears of a deep recession can quickly make Gold price escalate due to its safe-haven status. As a yield-less asset, Gold tends to rise with lower interest rates, while higher cost of money usually weighs down on the yellow metal. Still, most moves depend on how the US Dollar (USD) behaves as the asset is priced in dollars (XAU/USD). A strong Dollar tends to keep the price of Gold controlled, whereas a weaker Dollar is likely to push Gold prices up.
Author

Dhwani Mehta
FXStreet
Residing in Mumbai (India), Dhwani is a Senior Analyst and Manager of the Asian session at FXStreet. She has over 10 years of experience in analyzing and covering the global financial markets, with specialization in Forex and commodities markets.


