Gold Price Forecast: Increasing signs of an upcoming bearish run

XAU/USD Current price: $1,872.23
- An uptick in US Treasury yields and weaker indexes back the greenback in the American session.
- Federal Reserve President Thomas Barkin's encouraging words weighed on sentiment.
- XAU/USD changed course after hitting a fresh weekly high and flirts with the base of the range.
The lack of US Dollar follow-through finally played against the American currency. XAU/USD extended its weekly advance to $1,890.21 before losing its bullish momentum to post a daily low of $1,865.68. The USD gathered strength after Wall Street's opening, as US Treasury yields trimmed pre-opening losses while stock indexes pulled away from their early highs.
The yield on the 10-year Treasury note currently hovers around 3.60%, while the 2-year note offers 4.46%. The US Dollar benefited from comments from Richmond Federal Reserve President Thomas Barkin, who said that the effects of the Fed's policy tightening has been substantial while adding that macroeconomic data put back the risk of a recession.
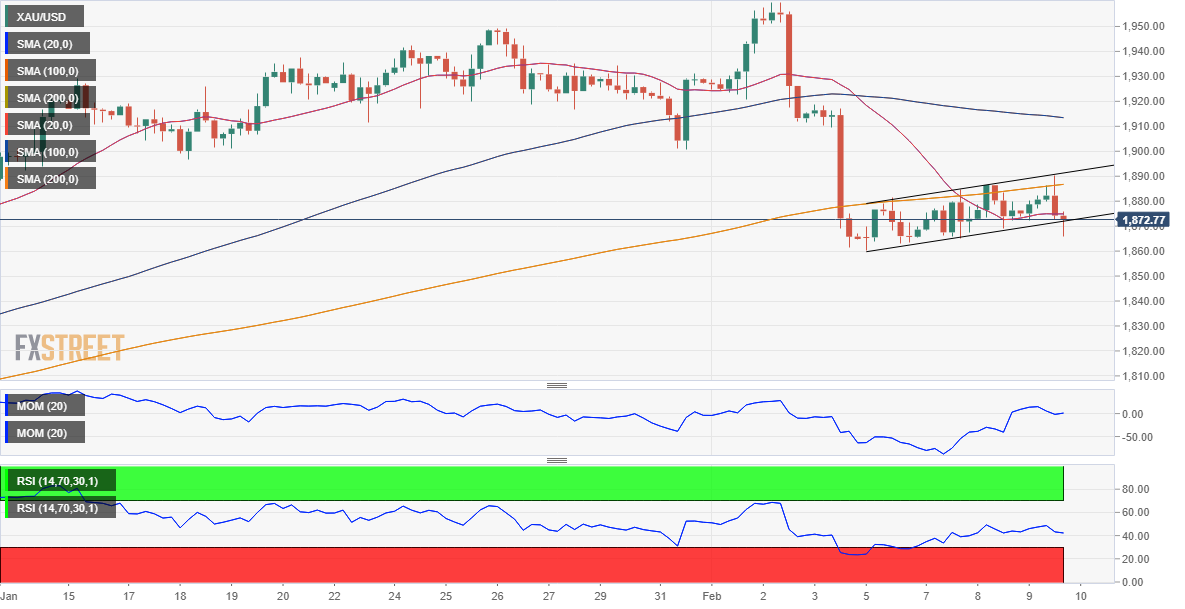
XAU/USD price short-term technical outlook
The XAU/USD pair advanced for a fourth consecutive day and continued to post higher highs, usually a sign of further gains ahead. However, technical readings in the daily chart fall short of anticipating a steeper rally. On the one hand, technical indicators remain directionless within negative levels. On the other, the bright metal continues to develop below a directionless 20 SMA, currently at around $1,913. Finally, the 100 SMA advances below the 200 SMA, but both moving averages develop over $100 below the current level, providing no near-term directional clues.
The 4-hour chart that the pair was developing in a near-term ascendant channel coming from this week's low posted on Monday at $1,860.20, also a one-month low. The top of the figure is currently at $1,893.50, the level to break for a more sustainable bullish run. However, XAU/USD is currently piercing the base of the figure. A close below it should invalidate the figure while hinting at additional slides.
At the same time, the pair is developing below all of its moving averages. The Momentum indicator stands pat around its midline, but the RSI indicator picked up bearish strength and heads south at around 41, also supporting a near-term bearish continuation.
Support levels: 1,860.20 1,847.60 1,835.10
Resistance levels:1,881.50 1,893.50 1,903.00
Premium
You have reached your limit of 3 free articles for this month.
Start your subscription and get access to all our original articles.
Author

Valeria Bednarik
FXStreet
Valeria Bednarik was born and lives in Buenos Aires, Argentina. Her passion for math and numbers pushed her into studying economics in her younger years.