Gold Price Forecast: En route to retest November 2021 high at $1,877.15

XAU/USD Current price: $1,841.45
- US inflation soared to an almost five-decade high of 7.5% YoY.
- The yield on the US Treasury 10-year note jumped to its highest since 2019.
- XAU/USD positive momentum hints at fresh 2022 highs in the near term.
Spot gold dipped to $1,821.45 following the release of higher-than-anticipated US inflation figures but quickly changed course and trimmed losses, now trading near a daily high of $1,841.93 a troy ounce. The greenback rallied following the release of the US January Consumer Price Index, which soared to 7.5% YoY in January, much higher than anticipated and the highest since February 1982.
The American currency plummeted despite Wall Street feeling the heat and losing its positive momentum, with most indexes now trading in the red. At the same time, US Treasury yields soared, with that on the 10-year note hitting 2.02%, its highest since 2019, and the 2-year note yielding as much as 1.51%.
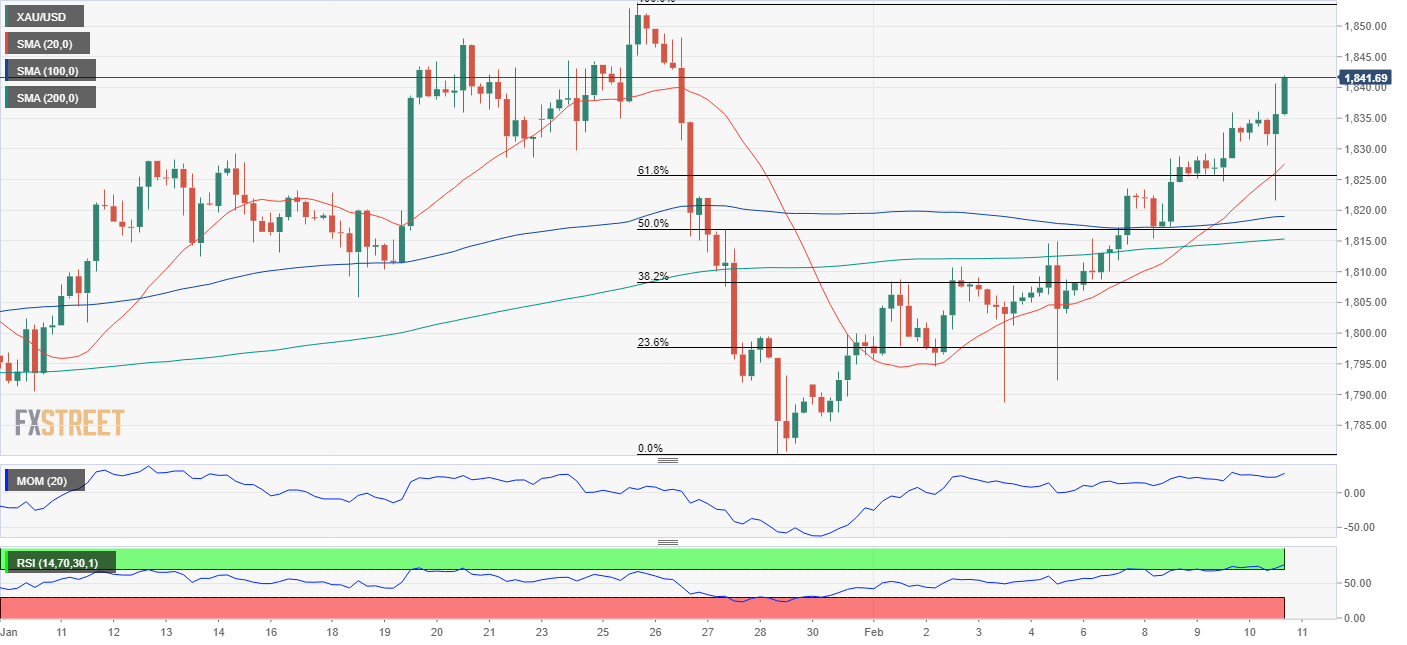
Gold price short-term technical outlook
The XAU/USD pair is up for a fifth consecutive day and has room to extend its advance. The daily chart shows that the Momentum indicator is finally crossing its midline into positive levels, as the RSI indicator maintains a strong bullish slope at around 61. At the same time, the pair has broken below the 61.8% retracement of its latest daily slump, opening the door for a retest of the year high at 1,853.83.
The 4-hour chart hints at another leg higher in the near term, as technical indicators turned firmly higher within positive levels as the metal develops above all of its moving averages. The 20 SMA heads firmly north above the longer ones, reflecting strong buying interest. As said, gold has room to extend gains up to this year high, while a break above the latter could see the pair extending to 1,864.50, the next resistance level, en route to 1,877.15, November monthly high.
Support levels: 1,825.60 1,818.50 1,808.10
Resistance levels: 1,853.85 1,864.50 1,877.15
Premium
You have reached your limit of 3 free articles for this month.
Start your subscription and get access to all our original articles.
Author

Valeria Bednarik
FXStreet
Valeria Bednarik was born and lives in Buenos Aires, Argentina. Her passion for math and numbers pushed her into studying economics in her younger years.


