Gold Price Forecast: Bulls may finally win the battle

XAU/USD Current price: $1,823.29
- Gold trades near a critical Fibonacci resistance level at $1,825.10 a troy ounce.
- As long as the US Federal Reserve maintains tapering, the dollar will remain pressured.
- XAU/USD offers a neutral-to-bullish stance in the near term as long as above 1,810.40.
After peaking at $1,833.95 a troy ounce on Friday, the price of gold has been on retreat mode, currently trading around 1,823. The bright metal is back to not yet trimmed all of its post-Nonfarm Payrolls gains, but it is trading below the 38.2% retracement of its March/June rally at 1,825.10. However, XAU/USD trades nearby, somehow suggesting that bulls may give it another try to finally clear the level. Ever since breaking below it mid-June, the metal has tried multiple times to break above it, trading as high as 1,834.09.
The dollar remains on the back foot after a soft US monthly employment report which hinted at a patient Fed’s approach to tapering. Several US Federal Reserve officials have spread hawkish messages ahead of the employment report, suggesting the central bank may kick-start tapering before the year-end. However, Chair Jerome Powell cooled down hopes when speaking in the Jackson Hole Symposium, with employment data confirming his dovish stance.
Gold price short-term technical outlook
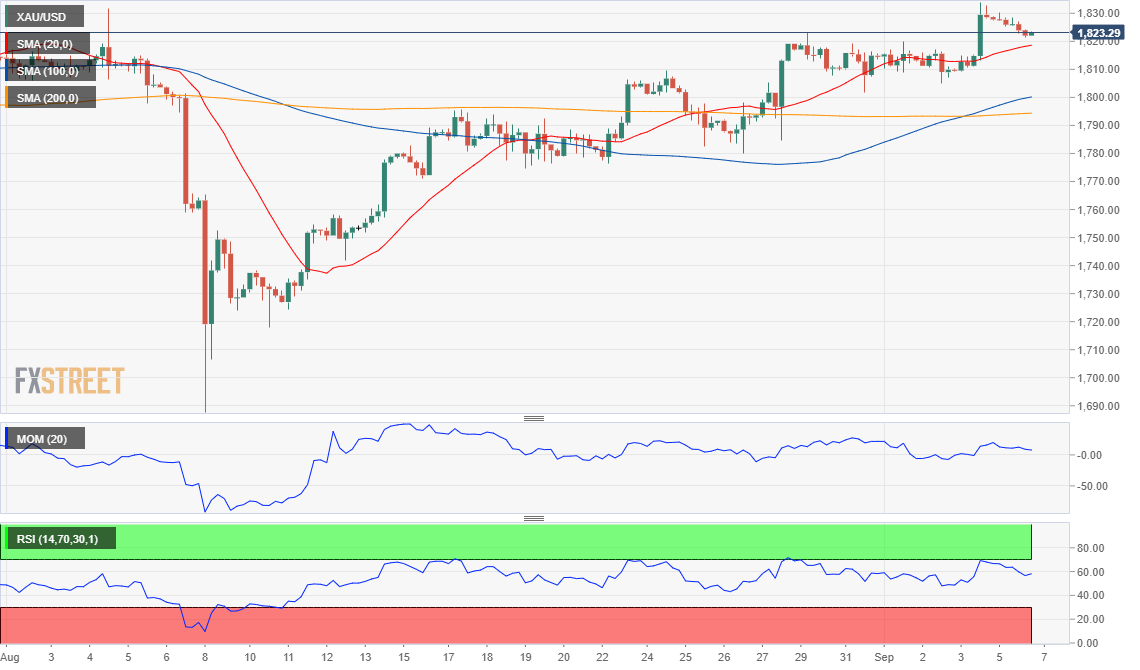
XAU/USD has pulled back modestly despite the strong momentum of European equities, which started the week with substantial gains, reflecting absent demand for the American currency. The daily chart for spot shows that the price holds above all of its moving averages, with the 20 SMA advancing but below the longer ones. Meanwhile, technical indicators consolidate within positive levels, lacking directional strength but maintaining the risk skewed to the upside.
In the near term, and according to the 4-hour chart, the metal offers a neutral-to-bullish stance, given that it is trading above all of its moving averages, with the 20 SMA above the longer ones and the 100 SMA accelerating north above the 200 SMA. However, technical indicators are heading mildly lower, although still within positive levels. Bulls may have a chance as long as the pair holds above 1,810.40, the immediate support level, with a break of the Fibonacci resistance, opening doors for an extension toward $1,842.50.
Support levels: 1,810.40 1,797.00 1.787.55
Resistance levels: 1,825.10 1,834.10 1,842.50
Premium
You have reached your limit of 3 free articles for this month.
Start your subscription and get access to all our original articles.
Author

Valeria Bednarik
FXStreet
Valeria Bednarik was born and lives in Buenos Aires, Argentina. Her passion for math and numbers pushed her into studying economics in her younger years.


