Gold Price Forecast: Bullish breakout as imminent as Russian invasion

XAU/USD Current price: $1,867.35
- Demand for safe-haven assets has resumed amid concerns over a war in Europe.
- Government bond yields fell to fresh weekly lows amid a run to safety.
- XAU/USD has room to extend its advance, despite technical overbought readings.
Spot gold flirts with the $1,900 threshold amid renewed tensions on the Russia-Ukraine border. So far, news’ headlines have pointed out that Western nations believe that not only Russia is not retreating but preparing for an invasion. During Asian trading hours, Ukrainian forces and pro-Moscow rebels traded fire.
Things escalated after Russia ejected US officials from their embassy and accused Washington of ignoring its security demands, while US President Joe Biden accused Moscow of creating drama to justify an invasion. Demand for safety returned to financial markets, and gold made the most out of it.
European indexes, which were struggling to retain gains, turned red, dragging Wall Street lower. Government bonds appreciated, and yields reached fresh weekly lows. Generally speaking, market players fear chaos but are still hoping for the better, as panic did not reach financial boards.
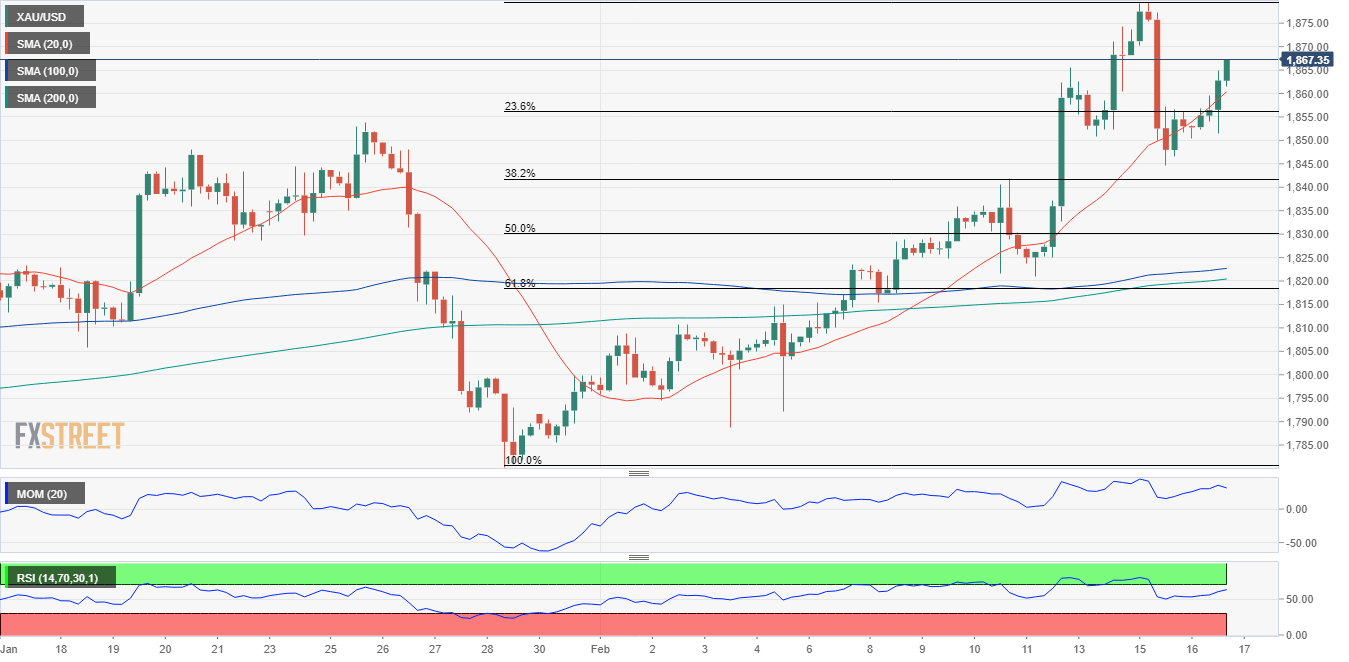
Gold price short-term technical outlook
The XAU/USD pair trades at $1,896 a troy ounce at the time being, at levels that were previously seen on June 2021. The bright metal is bullish, despite overbought, according to the daily chart, as it keeps pressuring its daily highs, which keeps technical indicators heading north near extreme levels. Moving averages turned higher but remain well below the current level.
The 4-hour chart shows that the Momentum indicator heads north almost vertically, while the RSI indicator turned flat at around 76. Meanwhile, the 20 SMA keeps heading firmly higher now at around $1,862, far above the longer ones. The bullish run could extend once the metal surpasses 1,902.90, the immediate resistance level, as stops are likely accumulated just above the level.
Support levels: 1,855.90 1,841.40 1,829.70
Resistance levels: 1,879.50 1,887.25 1,902.90
Premium
You have reached your limit of 3 free articles for this month.
Start your subscription and get access to all our original articles.
Author

Valeria Bednarik
FXStreet
Valeria Bednarik was born and lives in Buenos Aires, Argentina. Her passion for math and numbers pushed her into studying economics in her younger years.


