Gold Price Forecast: $2,890 - a tough nut to crack for XAU/USD sellers?
- Gold price reverses previous gains to tread water above $2,900 early Thursday.
- US Dollar rebounds on mixed Trump’s tariff messages and firm US Treasury bond yields.
- Gold buyers defend the 21-day SMA at $2,890 as the daily RSI stays bullish.
- The Q4 US GDP revision and Fedspeak could provide fresh impetus to Gold traders.

Gold price is unable to hold on to the modest gains booked on Wednesday as buyers and sellers enter a tug-of-war situation early Thursday, courtesy of the uncertainty around US President Donald Trump’s tariff plans and lingering US economic concerns.
Gold price down but not out ahead of US GDP, Trump
Following his Tuesday remarks that 25% tariffs on Canada and Mexico remain on track from March 4, Trump shifted his message in American trading on Wednesday, noting that steep 25% tariffs on Mexican and Canadian goods could take effect on April 2.
Trump’s conflicting messages keep the haven demand for the US Dollar (USD) alive and kicking at the expense of the Gold price. Further, the rebound in the US Treasury bond yields also check the Gold price upside.
Additionally, the end-of-the-month short-covering contributes to the recent USD upswing. The Greenback is down nearly 4% from a more than two-year high hit in January.
Upbeat results from the American artificial intelligence (AI) leader Nvidia, following Wednesday’s market close, seem to keep the broader market sentiment lifted, reflected by the 0.20% gain in the US S&P 500 futures.
The cautiously optimistic market mood reduces the demand for the US government bonds, fuelling a modest uptick in the US Treasury bond yields.
However, any downside in Gold price could be quickly bought into as markets continue to price in two interest rate cuts by the US Federal Reserve (Fed) this year in the face of mounting economic slowdown concerns. US Consumer Confidence Index declined 7 points on Tuesday, its most significant fall since August 2021, to 98.3, well below the Reuters estimate of 102.5.
Therefore, all eyes remain on the US Gross Domestic Product (GDP) second revision print for the fourth quarter of 2024 for fresh signs on the health of the economy, which could significantly impact the direction of the Fed interest rates and the US Dollar, eventually influencing the non-yielding Gold price.
The second estimate of the US GDP is expected to show a 2.3% annualized growth in Q4 2024, as seen in the advance release. Gold buyers will likely jump back in the game on a downward revision to the preliminary reading and vice-versa.
Also of note will be the US Durable Goods Orders, Pending Home Sales data and speeches from several Fed policymakers. However, US President Donald Trump’s media address later in the early American session could steal the show and reverse any Gold price reaction to the US data releases.
Gold price technical analysis: Daily chart
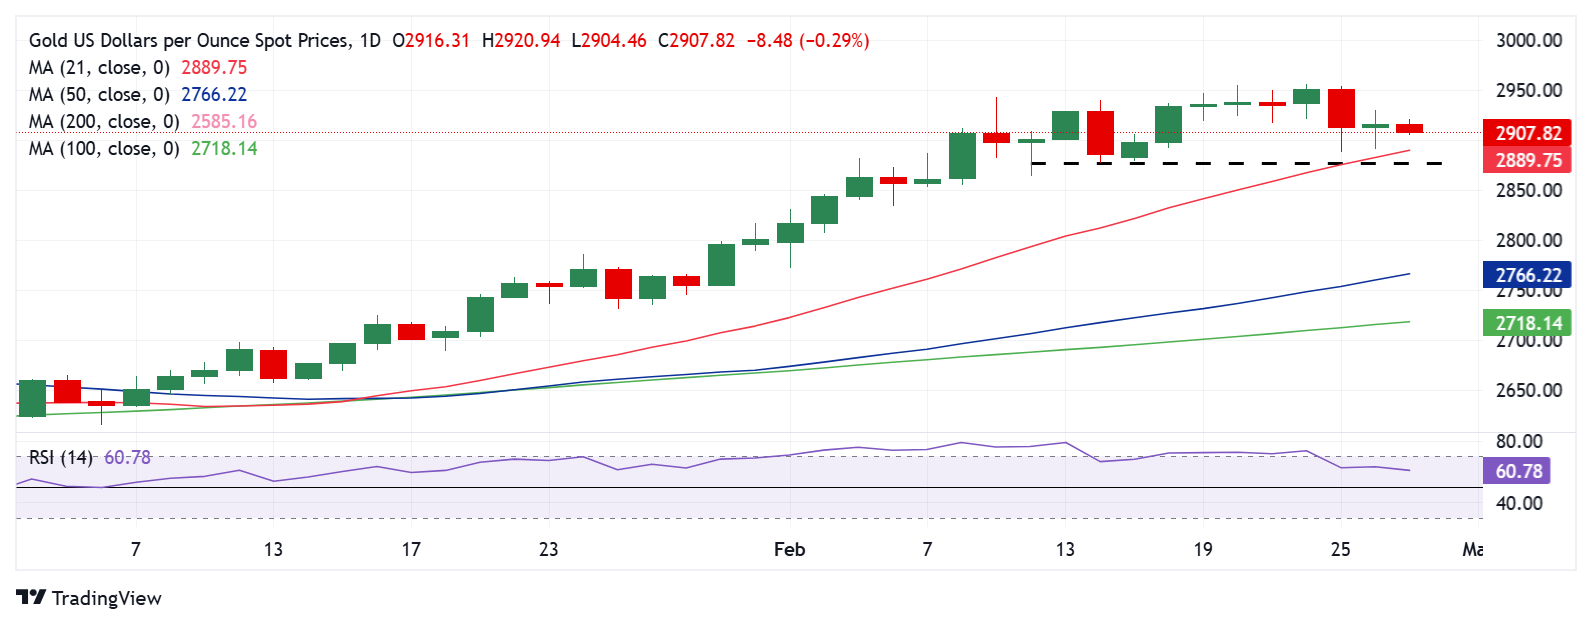
Gold price outlook appears more or less the same from a short-term technical perspective.
So long as the Gold price defends the 21-day Simple Moving Average (SMA) at $2,890 and the 14-day Relative Strength Index (RSI) sits above 50, the bullish potential will likely remain intact.
Gold buyers could retest the all-time highs at $2,956 on acceptance above the previous day’s high of $2,930. The next topside barriers are seen at the $2,970 resistance and the $3,000 threshold.
If sellers crack the 21-day SMA at $2,890 on a daily candlestick closing basis, the downside could open toward the February 14 low of $2,877.
The last line of defense for Gold buyers is at the $2,850 psychological barrier.
Economic Indicator
Gross Domestic Product Annualized
The real Gross Domestic Product (GDP) Annualized, released quarterly by the US Bureau of Economic Analysis, measures the value of the final goods and services produced in the United States in a given period of time. Changes in GDP are the most popular indicator of the nation’s overall economic health. The data is expressed at an annualized rate, which means that the rate has been adjusted to reflect the amount GDP would have changed over a year’s time, had it continued to grow at that specific rate. Generally speaking, a high reading is seen as bullish for the US Dollar (USD), while a low reading is seen as bearish.
Read more.Next release: Thu Feb 27, 2025 13:30 (Prel)
Frequency: Quarterly
Consensus: 2.3%
Previous: 2.3%
Source: US Bureau of Economic Analysis
The US Bureau of Economic Analysis (BEA) releases the Gross Domestic Product (GDP) growth on an annualized basis for each quarter. After publishing the first estimate, the BEA revises the data two more times, with the third release representing the final reading. Usually, the first estimate is the main market mover and a positive surprise is seen as a USD-positive development while a disappointing print is likely to weigh on the greenback. Market participants usually dismiss the second and third releases as they are generally not significant enough to meaningfully alter the growth picture.
Author

Dhwani Mehta
FXStreet
Residing in Mumbai (India), Dhwani is a Senior Analyst and Manager of the Asian session at FXStreet. She has over 10 years of experience in analyzing and covering the global financial markets, with specialization in Forex and commodities markets.


