Gold price climbs ahead of US CPI data: Key levels and trading strategies

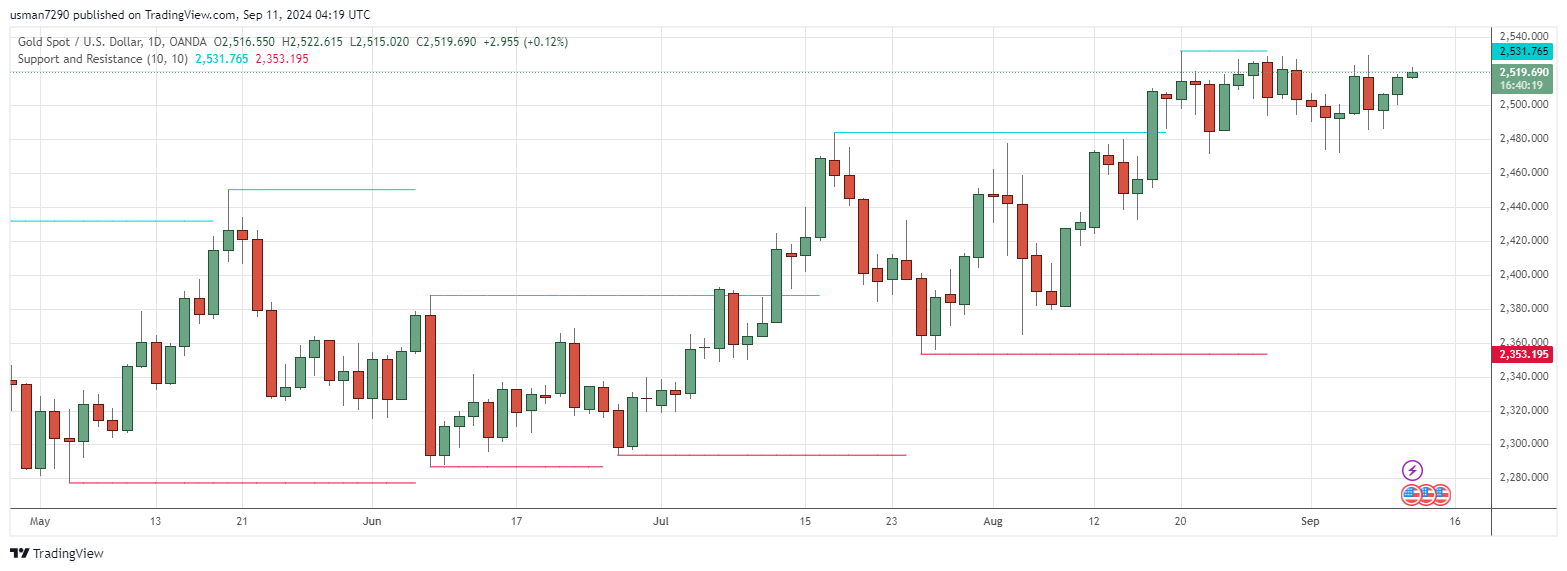
Gold prices (XAU/USD) are on an upward trajectory for the third day in a row, approaching a fresh weekly top around the $2,520 mark. The rise is fueled by cautious market sentiment and a softer US Dollar, but traders are holding back from aggressive positions ahead of the critical US Consumer Price Index (CPI) report. This report is expected to shape market expectations for the Federal Reserve's policy decisions at the upcoming meeting on September 17-18, which could provide a clearer direction for gold's next move.
Technical analysis and key levels to watch
Immediate resistance and breakout potential: Gold is currently testing the $2,525-$2,526 supply zone, which is a significant resistance level. A clear breakout above this range could trigger a strong buying wave, pushing prices towards $2,532 and potentially beyond, aligning with the recent bullish trend. Traders should look for sustained price action above $2,526 as a confirmation for further upside, targeting the all-time highs.
Downside support and risk management: On the downside, immediate support lies at the $2,500 psychological level, followed by the $2,485 and $2,470 zones. These levels represent the lower boundary of the current trading range and are critical for maintaining the bullish structure. A break below $2,470 could lead to accelerated selling, targeting the 50-day Simple Moving Average (SMA) around $2,450-$2,449, and potentially extending towards sub-$2,400 levels if the bearish momentum intensifies.
Actionable trading strategies
Bullish strategy: Consider going long on a confirmed breakout above the $2,526 level with a target of $2,532 initially, and extend positions towards the all-time high if momentum continues. Set a stop loss just below the $2,500 mark to protect against downside risk if the breakout fails.
Range trading strategy: If gold remains range-bound between $2,500 and $2,526, traders could explore buying near the lower end of the range ($2,500-$2,485) and selling near resistance at $2,526, using tight stop losses to manage risk. This strategy takes advantage of the current consolidation phase while awaiting a clearer directional move.
Bearish strategy: For a bearish outlook, look for shorting opportunities if gold breaks below the $2,470 support level, with initial targets set at the 50-day SMA near $2,450 and further downside towards $2,400. A stop loss just above $2,485 would help manage risk in case of a false breakdown.
Market sentiment and external factors
Monitor US CPI data: The upcoming CPI report is a crucial catalyst that could shift market sentiment significantly. A weaker-than-expected inflation print could boost gold by increasing bets on aggressive Fed rate cuts, while a stronger print might limit upside but is unlikely to reverse the market's dovish expectations.
Fed rate cut bets: According to the CME FedWatch Tool, there is currently a 67% chance of a 25-basis-point rate cut at the next FOMC meeting. Traders should keep an eye on how this probability evolves post-CPI, as it will directly impact gold's safe-haven appeal.
By focusing on these key levels and adjusting positions based on the latest market data and technical signals, traders can navigate gold's price action effectively as the market braces for pivotal US economic data.
Author

Usman Ahmed
Forex92
Usman Ahmed is a currency trader and financial market analyst with more than a decade of active trading experience.


