Gold price analysis: XAU/USD is above $1760/oz, bullish at the end of week

Gold in the last Newyork session has significantly grown up, from $1734/oz to $1768/oz. This is the strongest and highest increase in April.
The DXY - US Dollar Index breaks 91.75 points and creates a higher 91.85, after two weeks between 91.55 - 91.75.
This week, news such as Core retail sales, Unemployment claims were significant positive for the US economy and have played an important role for the recovery of the DXY. Moreover, the president of the US
Federal reserve - Mr. Jerome Powell, assured that it must be likely more economic stimulations than rising the interest rate.
Trendline analysis
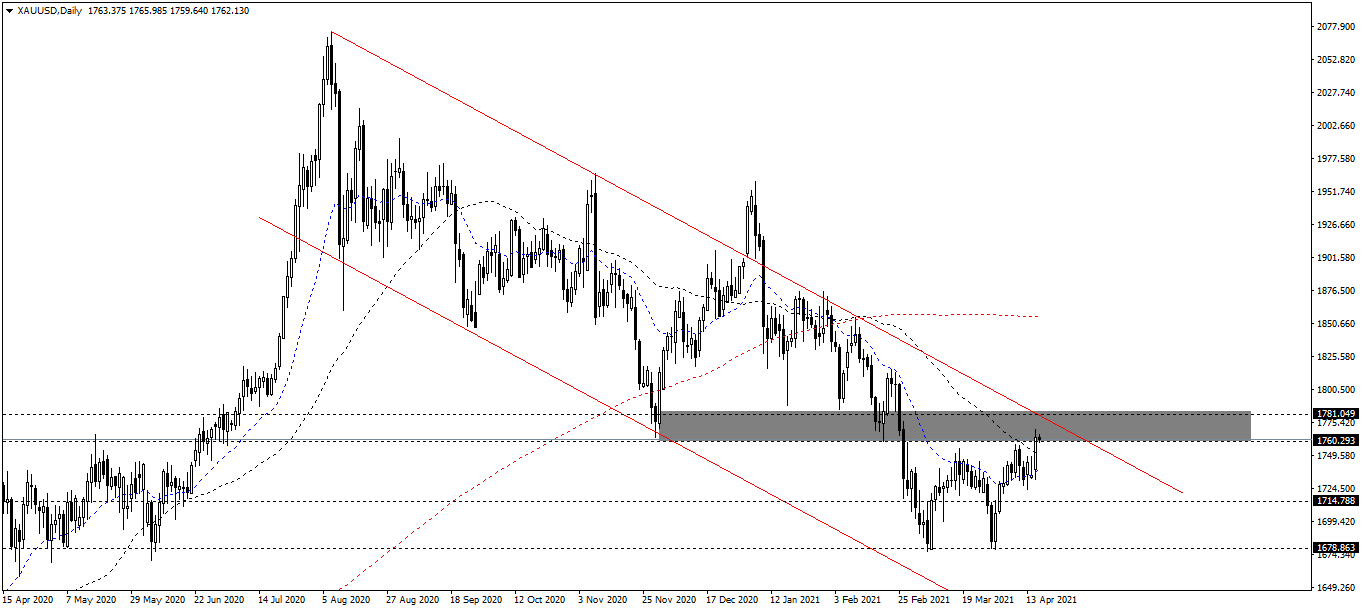
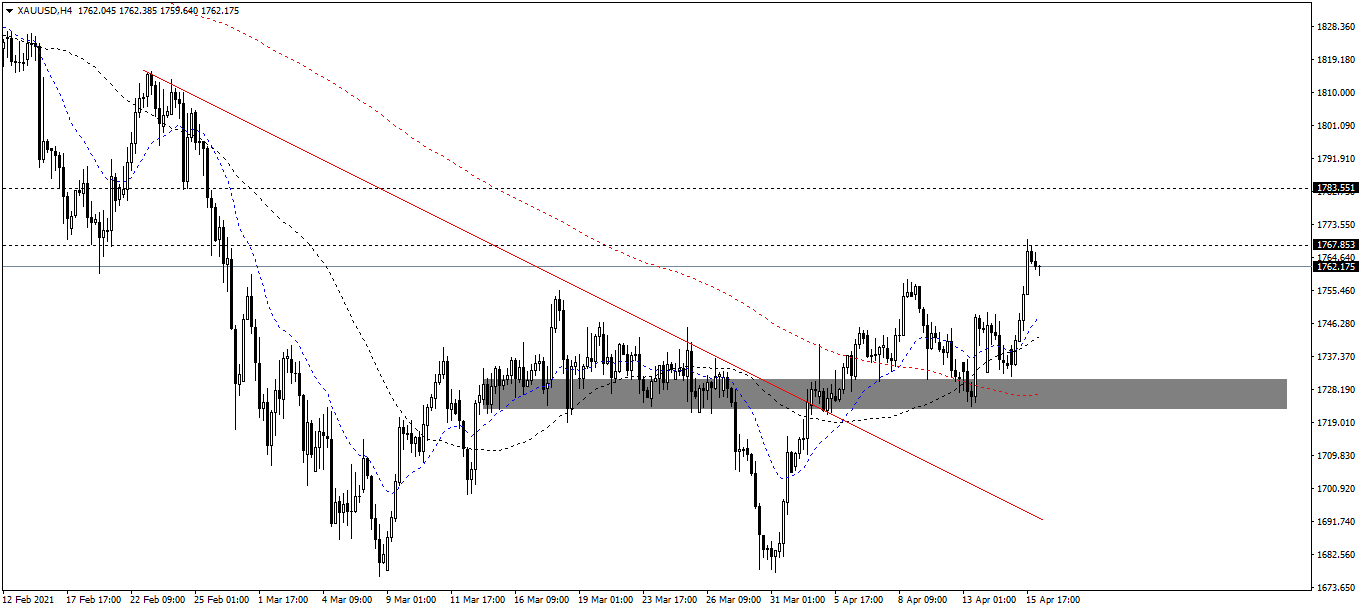
On the 4-hour chart, gold is still on the bullish trend after breaking out the downtrend (was formed from February 2021). On the daily chart, this bullish trend is considered as a correlation of the bearish main trend (which formed from August 2020). The maximum wavelength of this bullish trend is about $1770/oz - $1780/oz.
Resistance/Support analysis
The resistances are $1780/oz and $1815/oz.
The supports are $1680/oz, $1715/oz and $1755/oz.
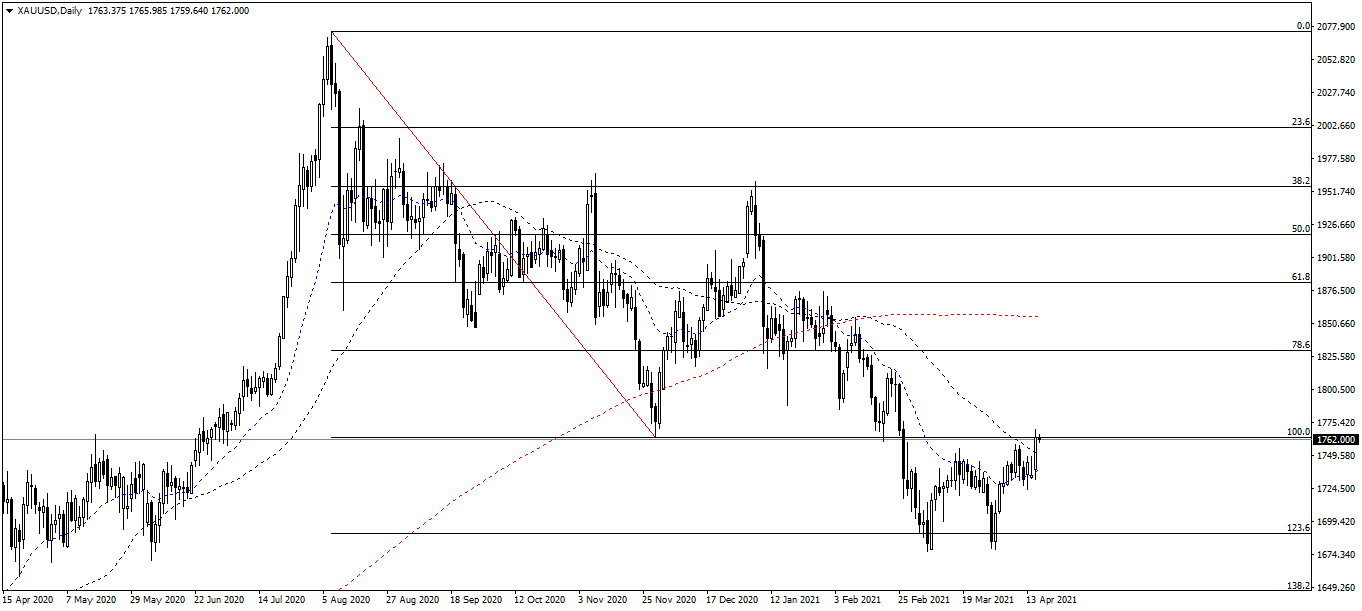
Fibonacci analysis
The Fibonacci has measured on the daily chart at:
- The $2080/oz: this is the highest price of gold over the time.
- The $1760/oz: this is the oldest support on the bearish trend. (formed from August 2020).
As I mentioned in my previous articles, gold is likely reaching the Fibonacci 100 at $1762/oz. This Fibonacci 100 is considered as significant resistance, involved in the volume of the bulls and the entry of the bears.
Moving Average MA
On the daily chart, the EMA20 is moving up and heading for the SMA50. Both the EMA20/SMA50 are above and make divergency from the SMA200. It means, in the mid-term and long-term, gold is bearish. In the short-term, the mainline is bullish, at least $1760/oz - $1780/oz zone.
On the 4-hour chart, both the EMA20/SMA50 crossed the SMA200 and went up. The SMA200 is considered as a flexible support. If gold gets over this door (bullish and closed price is above $1755/oz, it is likely gold reaches $1800/oz this week.
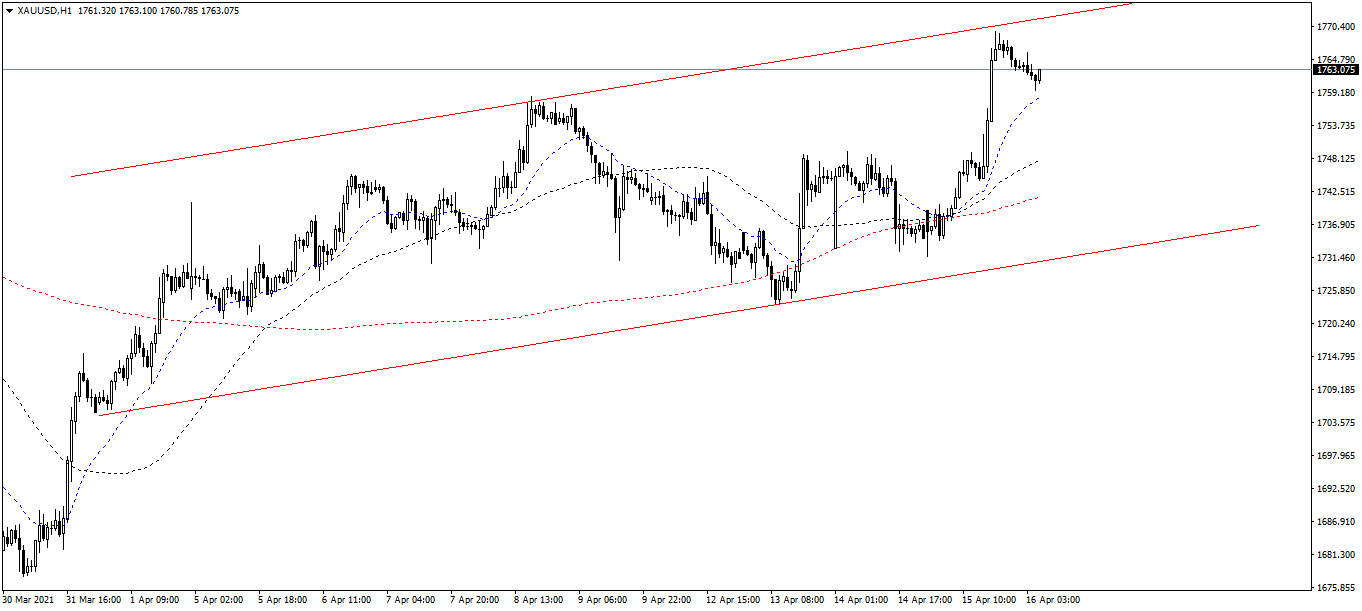
On the 1-hour chart, like the 4-hour chart above, the EMA20/SMA50 crossed the SMA200 and went up. Most especially, there is a chance for gold to climb up in the last session of this week.
In conclusion, gold continues to go up or at least make side away this week. However, investors should keep their eyes open for the last session of the week. In the mid-term, gold is bearish, the ATR indicator shows that it is highly reaching $1700/oz. Lastly, in the long-term, gold is significantly bearish.
Author

Thang Le
Independent Analyst
Thang Le is founder and owner of PSK - a financial community in Vietnam which at: Advising on strategic investment for individuals; Supporting the development of the investment community. He is Financial Analyst at Lion Group Hol


