Gold poised to explode, and soon

Gold continues to be Wall Street's good old and reliable workhorse, in the sense that it maintains its role as the most sought after safe-haven asset. The next few months look like are going to be quite turbulent and eventful, with the US election looming nearer, and the global pandemic continuing to worsen relentlessly. So, the precious metal would most certainly play a pivotal role for investors in surviving these tough and unpredictable times ahead.
In a sense, little has changed in gold's fundamental outlook since our previous analysis of the asset. The coronavirus crisis and the uncertainty stemming from the Presidential race continue to be the most significant determinants for gold's underlying supply and demand dynamic. The only difference is that the impact of those two has become more pronounced over the last few weeks.
The market has already priced in a likely Joe Biden win, so the aftermath of the elections is unlikely to stir any major market surprises. However, if he does indeed win and then Donald Trump decides to dispute the results of the election in the US Supreme Court, this could prompt new rounds of uncertainty. Consequently, the global demand for gold is likely to be further bolstered.
As regards the coronavirus crisis, yesterday's AstraZeneca vaccine news temporarily relieved the strained global markets, but pressure is bound to keep mounting as the global cases surge. Eventually, Governments are going to be forced to reintroduce stricter containment measures, which, in turn, would support the high demand for gold.
Overall, the underlying fundamentals seem to suggest that the price of the precious commodity is likely to continue appreciating in the following weeks and months; however, as it is about to be seen, the technical picture is less clear-cut.
1. Long-Term Outlook:
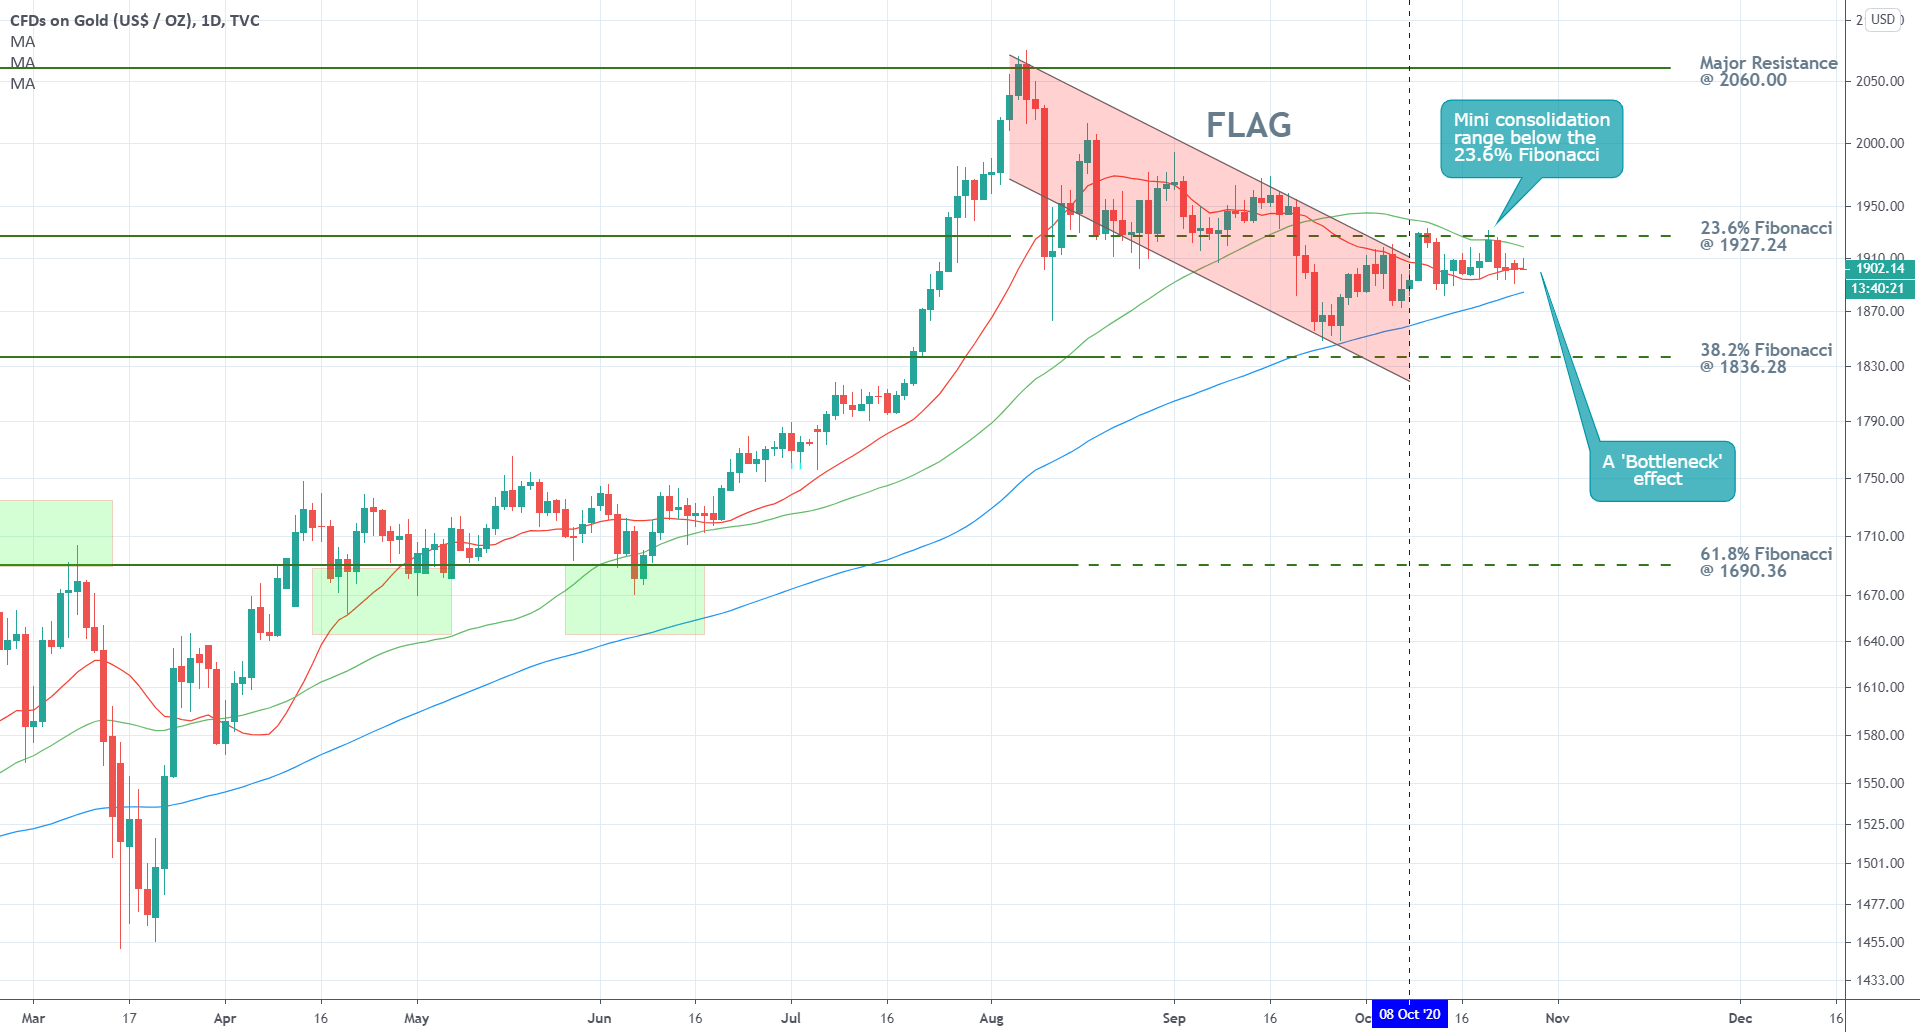
As can be seen on the daily chart below, the price action of gold is currently contained close to the upper boundary of a consolidation range. The latter spans between the 23.6 per cent Fibonacci retracement level at 1927.24 and the 38.2 per cent Fibonacci retracement level at 1836.28. The range emerged on the 8th of October following the termination of the descending flag pattern.
The flag was terminated just above the 100-day MA (in blue), which has served the role of a major floating support since before the advent of the coronavirus crash. This first test of the moving average's strength in late-September represented the first major bearish test since March, which could potentially pan out to be an early prelude to the formation of a more sizable bearish downtrend.
What is particularly interesting is that the price action has been consolidating above the 100-day MA but below the 50-day MA (in green) over the last couple of weeks. Moreover, it is threading just above the 20-day MA (in red). This behaviour is currently creating a clearly visible 'Bottleneck' effect – the containment of the price action between the two bigger MAs.
Such muted price action typically entails diminished trading activity prior to the formation of a substantial breakout in either direction. Essentially, gold can be said to be currently experiencing the 'calm before the storm', as the old trading adage goes. If gold breaks out above the 50-day MA and the 23.6 per cent Fibonacci, then the next target would be the psychologically significant resistance at 2000.00. Conversely, a breakdown below the 100-day MA would clear the way for the bears to test the strength of the 38.2 per cent Fibonacci next.
2. Short-Term Outlook:
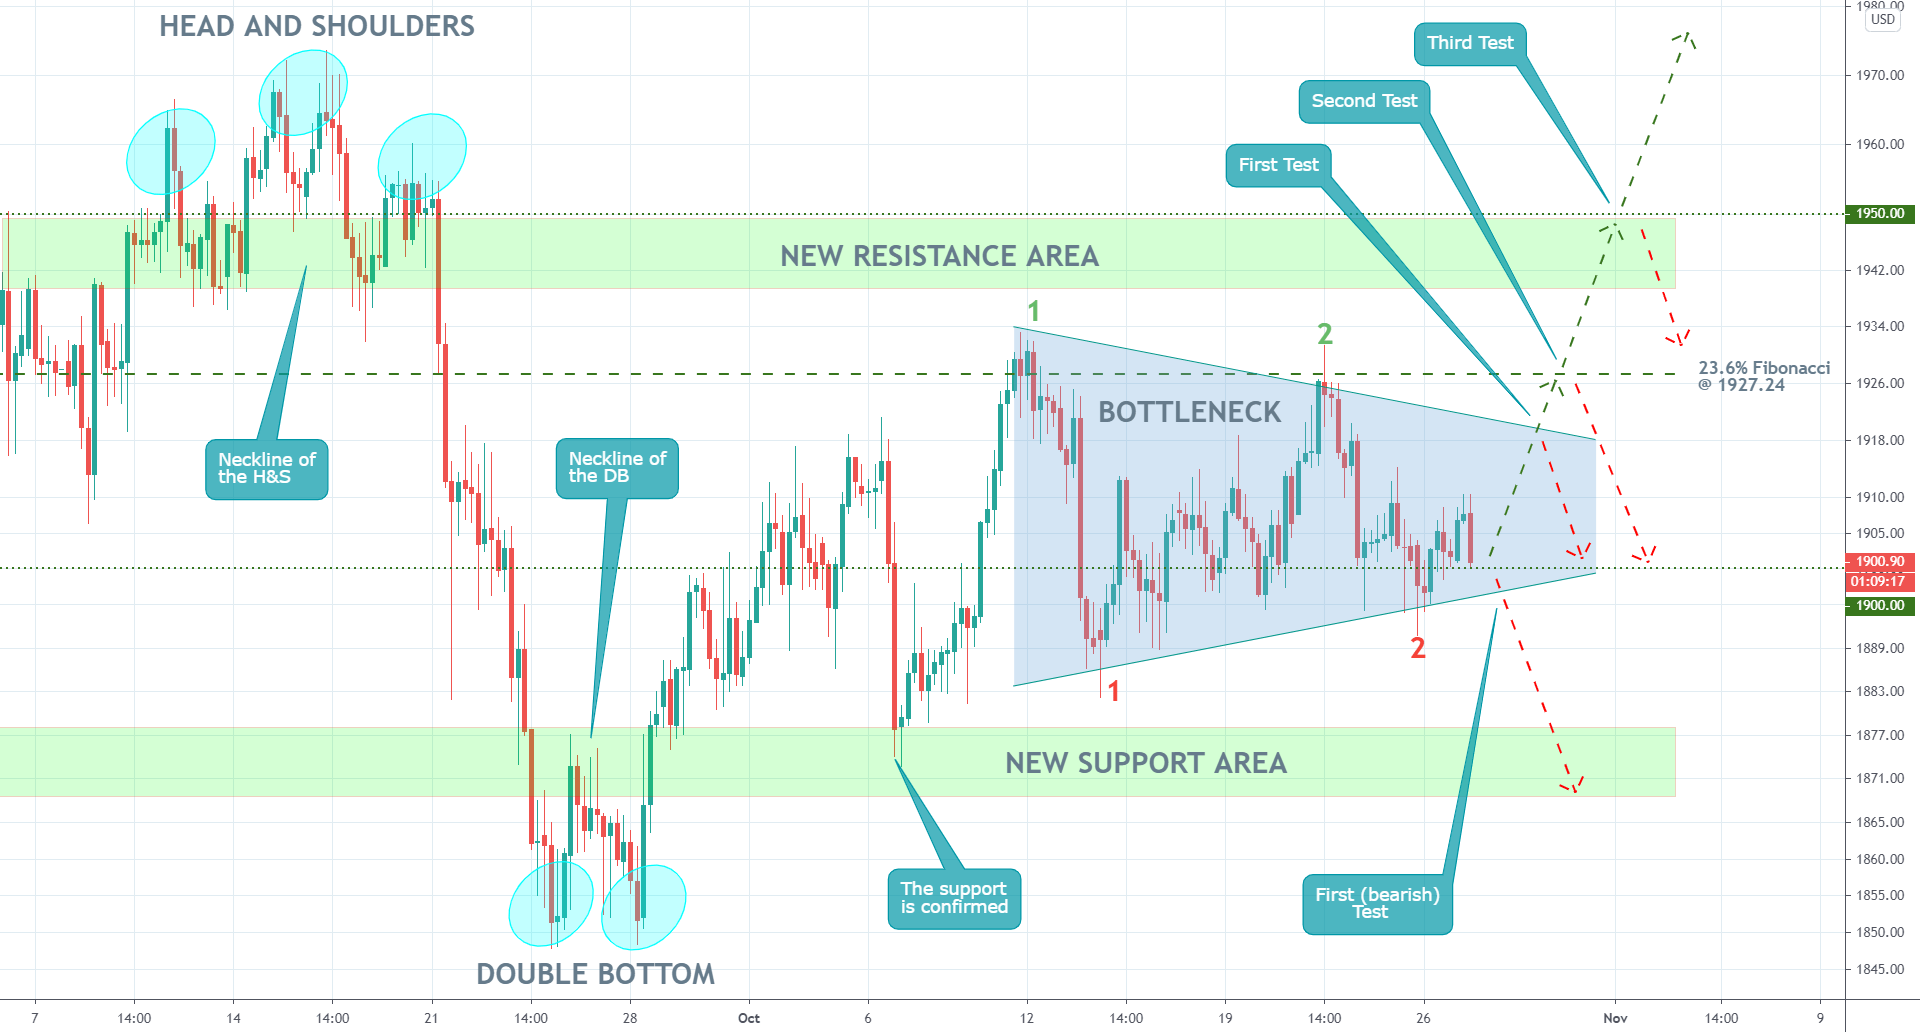
The 4H chart below encapsulates the nature of the bottleneck pattern itself. The price action has already tested twice the upper and lower limits of the bottleneck, which means that it could do so at least one more time before a decisive breakout/breakdown occurs.
Prior to the creation of the bottleneck, the price action established one head and shoulders pattern, and one double bottom pattern. The neckline areas of the two roughly outline two crucial areas, one resistance and one support. Hence, the eventual breakout/down from the bottleneck would also have to deal with the two areas in green.
Given the aforementioned fundamentals, a bullish breakout seems more plausible; however, a potential breakdown should not be completely dismissed either. At present, the price action finds itself trading just above the psychologically significant support at 1900.00, which is a prominent turning point. A potential breakdown below it would entail decisiveness of the market bears and could lead to further downswings south.
In contrast, a breakout above the bottleneck would have to deal with three crucial tests – the upper boundary of the bottleneck itself; the 23.6 per cent Fibonacci; and the 1950.00 resistance.
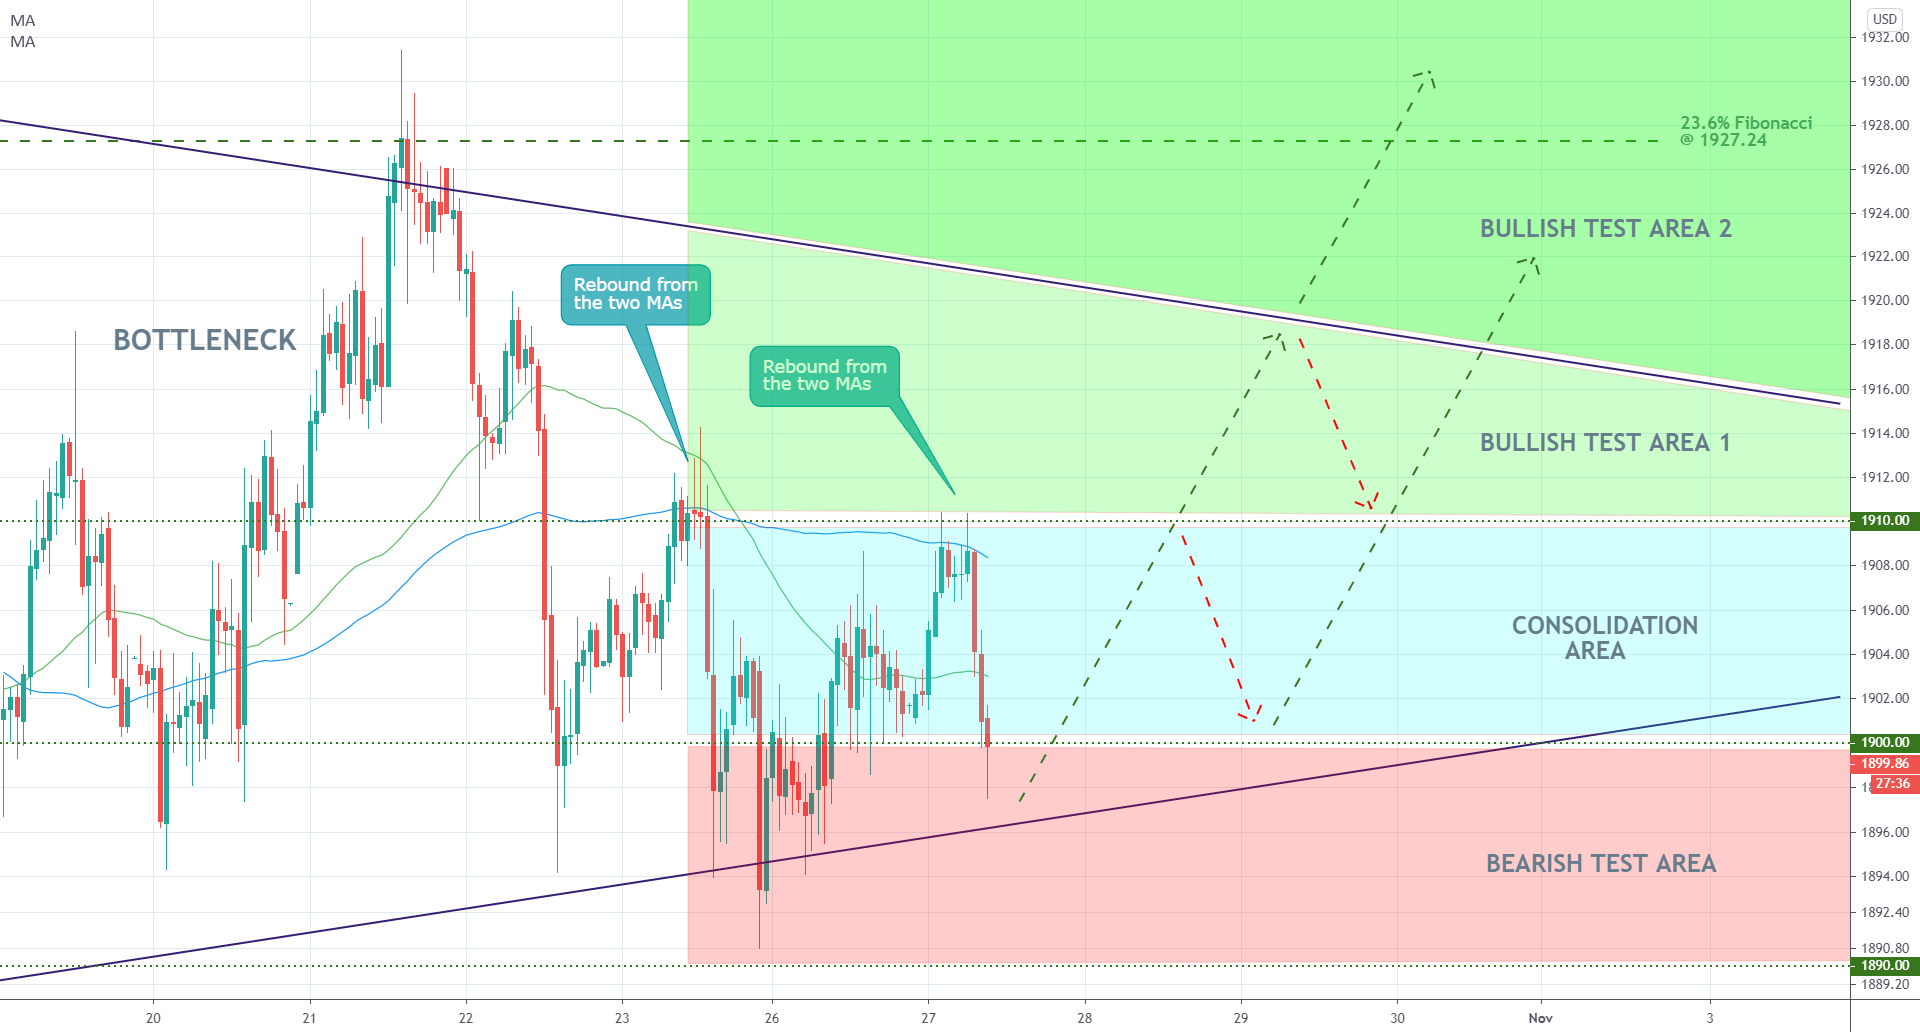
As can be seen on the hourly chart below, the price action has already rebounded from the 100-day MA on two separate occasions, which represents a substantial confirmation of the short-term bearish bias in the market. Nevertheless, the price action is probing but failing to break down below the 1900.00 support, which manifests rising bullish pressure.
3. Concluding Remarks:
The market bears would be looking for an opportunity to use trend-continuation trading strategies (continuing the downswing from where the aforementioned flag left off), provided that the price action manages to break down below the bottleneck, the 1900.00 psychological support, and enters into the 'bearish test area'. Given the mostly bullish-oriented fundamentals and the fact that the price action remains concentrated above the 100-day MA on the daily chart, this approach is seen as entailing a high degree of risk.
The market bulls, in contrast, would be looking for an opportunity to use trend-reversal trading strategies. While the price action remains concentrated within the mostly neutral 'consolidation area', as seen on the hourly chart above, the bulls could suffer from adverse fluctuations. Accordingly, if the price action manages to break out above the 'bullish test areas 1 and 2', there would be more pieces of evidence justifying the longer-term bullish projections.
Author

Plamen Stoyanov
Trendsharks
Plamen started his career on the global capital markets in 2012 when he began trading with financial derivatives.


