SUPPORT: 1250/49    1238    1226    1222/18    1201/1199

RESISTANCE: 1267   1275   1282   1293/95   1304   1310

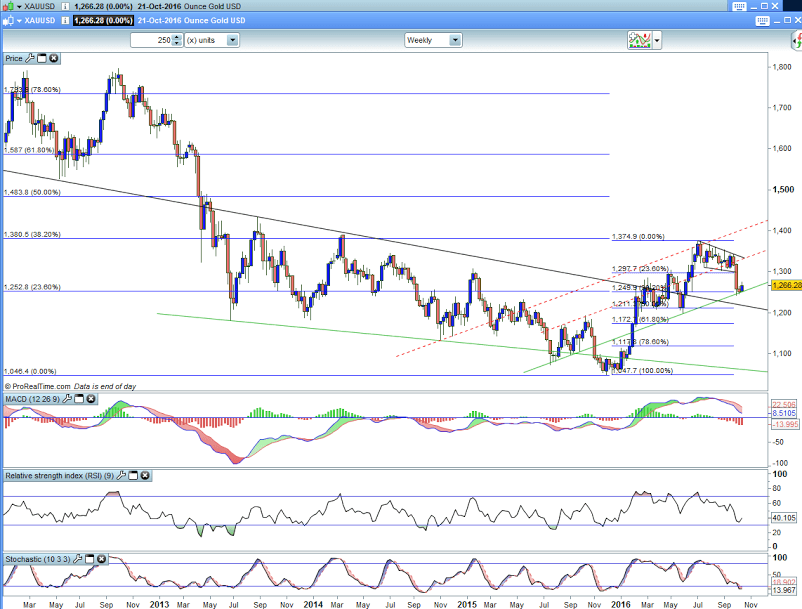
I have put a weekly chart up this time because I want you to see what Gold has actually been doing...It went lower...as we know...but once it broke the 1295 area you can see that we hit the 38.2 Long term fib and also a trendline that intersected with this fib...and buyers came out in force...we have seen the market rise to 1275...and fall back..However....buyers are still around in Gold...and they will be looking to go back in as long as the daily pennant trendline at 1257 does not break..Only then would there be a slight shift in sentiment and Gold could go back to the 38.2 Fib which is located in the 1249 area....Now we know this acted as good support previously...and markets as we all know can retrace 38.2 of the move and still be in a bull run...and if we look at the weekly charts we can see that we are still currently in a bull run....Now stochastics which were overbought at 1374 have now eased....Now look again at the weekly chart....1380 was the 38.2 retracement from the whole move down from 1921 way back in 2011....So please...whatever anyone tells you ...If you are trading Gold you really have to look at the longer term charts...To not do so will result in bad trading decisions and no one wants that....You can trade these markets from a professional traders point of view...and no one can say otherwise....So...look at the longer term charts...Understand what they mean to intra day trading...and always look at levels....you should know Gold levels inside out and back to front.....These levels will help you to actually trade more profitably....Now what next for Gold...well we are having a bit of a problem with 1275....we do need to clear this area before further buyers will be back in the market....If they can break this 1275 area there is no reason we cannot trade back to the break point of 1295...Also if 1275 breaks we can say that the uptrend resumes....the move was only correctionary  and we can go back to 1375...

XAUUSD


XAUUSD Current Trading Positions

Sell 36%
Buy 64%
100.0%36.0%0304050607080901000
Avg Sell Price 1258.39
Avg Buy Price 1277.71
Liquidity Distribution
1160.001282.041375.001160.001282.041375.00SellBuy


The research provided by Charmer Charts is provided solely to enable clients to make their own investment decisions and does not constitute personal investment recommendations. No recommendations are made directly or indirectly by Technicalanalysisreports.com or Charmer Charts as to the merits or suitability of any investment decision or transaction that may result directly or indirectly from having viewed the technical analysis investment research. Customers are therefore urged to seek independent financial advice if they are in any doubt. The value of investments and the income derived from them can go down as well as up, and you may not get back the full amount you originally invested. Derivatives and foreign exchange trading are particularly high-risk, high-reward investment instruments and an investor may lose some or all of his or her original investment. Also, if you decide to acquire any investment denominated in a different currency you should note that changes in foreign exchange rates may have an adverse effect on the value, price and income of the investment in your own currency. Technicalanalysisreports.com or Charmer Charts shall not be liable for any direct or indirect, incidental or consequential loss or damage (including loss of profits, revenue or goodwill) arising from the use, inability to use, interruption or non-availability of the technical analysis investment research or any part of the research materials published or otherwise any loss of data on transmission, howsoever caused. Whilst the research material published is believed to be reliable and accurate, it is not independently verified. Accordingly, no representation or warranty is made or given by Technicalanalysisreports.com or Charmer Charts, its officers, agents or employees as to the accuracy or completeness of the same and no such person shall have liability for any inaccuracy in, or omission from, such materials.

Recommended Content


Recommended Content

Editors’ Picks

USD/JPY holds above 155.50 ahead of BoJ policy announcement

USD/JPY holds above 155.50 ahead of BoJ policy announcement

USD/JPY is trading tightly above 155.50, off multi-year highs ahead of the BoJ policy announcement. The Yen draws support from higher Japanese bond yields even as the Tokyo CPI inflation cooled more than expected. 

USD/JPY News

AUD/USD extends gains toward 0.6550 after Australian PPI data

AUD/USD extends gains toward 0.6550 after Australian PPI data

AUD/USD is extending gains toward 0.6550 in Asian trading on Friday. The pair capitalizes on an annual increase in Australian PPI data. Meanwhile, a softer US Dollar and improving market mood also underpin the Aussie ahead of the US PCE inflation data. 

AUD/USD News

Gold price keeps its range around $2,330, awaits US PCE data

Gold price keeps its range around $2,330, awaits US PCE data

Gold price is consolidating Thursday's rebound early Friday. Gold price jumped after US GDP figures for the first quarter of 2024 missed estimates, increasing speculation that the Fed could lower borrowing costs. Focus shifts to US PCE inflation on Friday. 

Gold News

Stripe looks to bring back crypto payments as stablecoin market cap hits all-time high

Stripe looks to bring back crypto payments as stablecoin market cap hits all-time high

Stripe announced on Thursday that it would add support for USDC stablecoin, as the stablecoin market exploded in March, according to reports by Cryptocompare.

Read more

US economy: Slower growth with stronger inflation

US economy: Slower growth with stronger inflation

The US Dollar strengthened, and stocks fell after statistical data from the US. The focus was on the preliminary estimate of GDP for the first quarter. Annualised quarterly growth came in at just 1.6%, down from the 2.5% and 3.4% previously forecast.

Read more

Majors

Cryptocurrencies

Signatures