Gold is coming into strong support

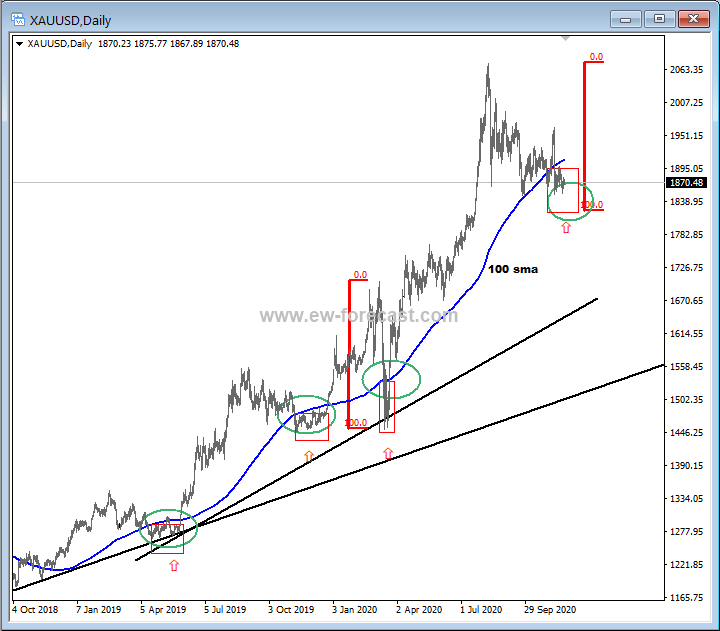
Gold is in consolidation mode since August, but we see price now approaching technical support. The daily technical chart is showing us that gold always breaks 100SMA before the uptrend resumes and if we consider the same wavelength as in March, then we should keep an eye on support around 1800 level.
Gold, daily
If we take a look at the 4h chart and its wave structure from the Elliott Wave perspective, we can see a bigger, bearish triangle pattern in wave B of a higher degree wave IV), so watch out for another decline to projected support around 1800 level for a wave C, ideally once the final wave E of B fully unfolds.
GOLD, 4h
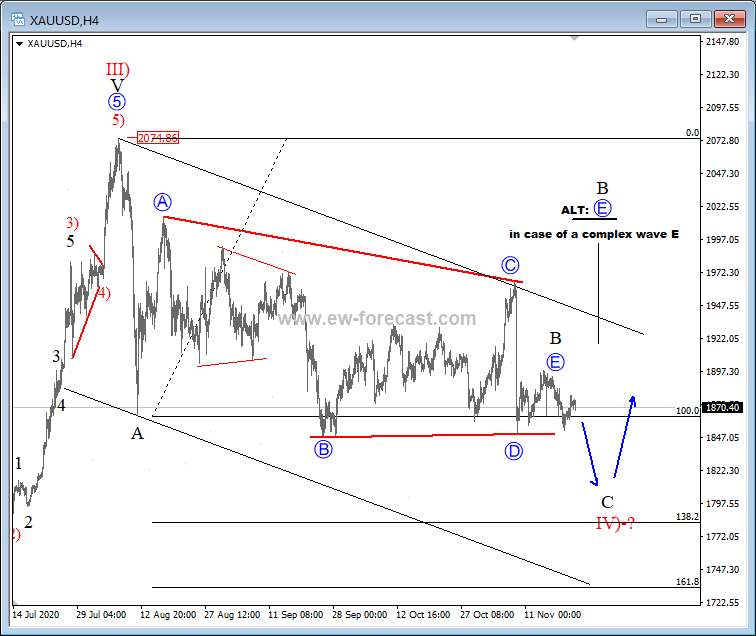
We believe that gold may find support somewhere at the end of the year, which means that we can expect a bullish continuation back to the highs for a wave V) at the end of 2020 or at the beginning of 2021.
Black Friday SALE: 70% DISCOUNT on your first month of membership. Join us andget access to unique and daily technical content about the forex and crypto markets.
Author

Gregor Horvat
Wavetraders
Experience Grega is based in Slovenia and has been in the Forex market since 2003.


