|

Gold found buyers after Elliott Wave zig zag pattern

In this technical blog we’re going to take a quick look at the Elliott Wave charts of GOLD (XAUUSD), published in members area of the website. As our members know the pair is showing impulsive bullish sequences in the cycle from the 2537.3  low.  Consequently , we were calling for the further rally in the commodity. Recently GOLD made a pull back that has had a form of Elliott Wave Zig Zag pattern.  In the further text we are going to explain the Elliott Wave Pattern and the forecast

Before we take a look at the real market example, let’s explain Elliott Wave Zigzag.

Elliott Wave Zigzag is the most popular corrective pattern in Elliott Wave theory . It’s made of 3 swings which have 5-3-5 inner structure. Inner swings are labeled as A,B,C where A =5 waves, B=3 waves and C=5 waves. That means A and C can be either impulsive waves or diagonals. (Leading Diagonal in case of wave A  or Ending in case of wave C) . Waves A and C must meet all conditions of being 5 wave structure, such as: having RSI divergency between wave subdivisions, ideal Fibonacci extensions and  ideal retracements.

Chart

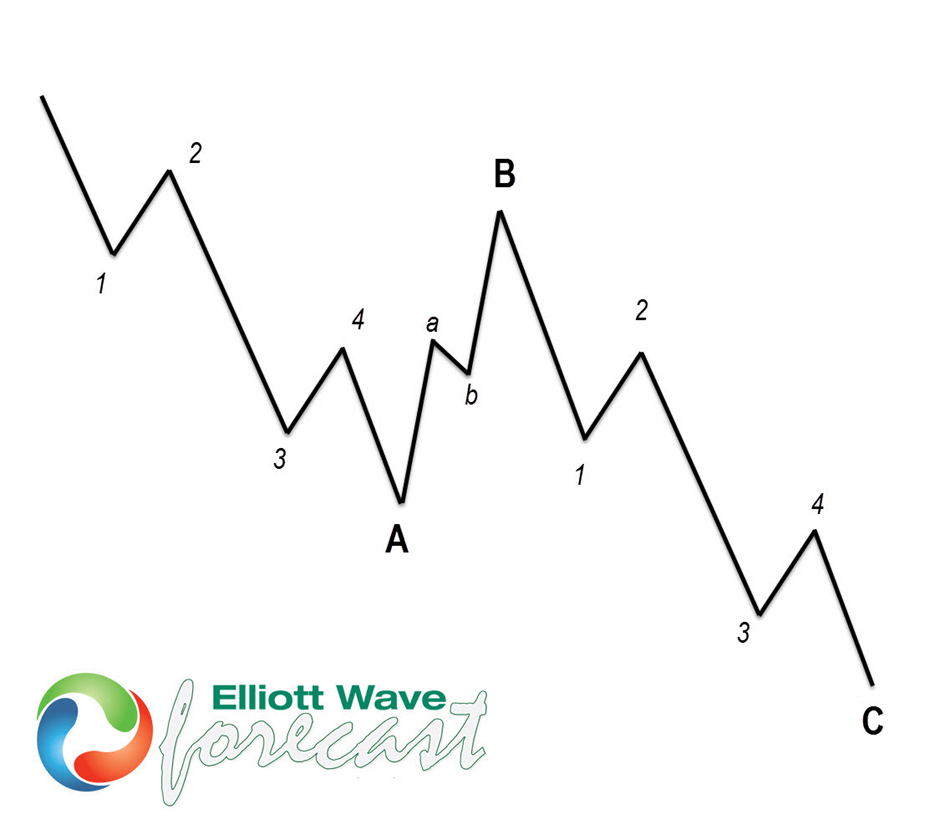
At the chart below we can see what Elliott Wave Zig Zag pattern looks like in real market.

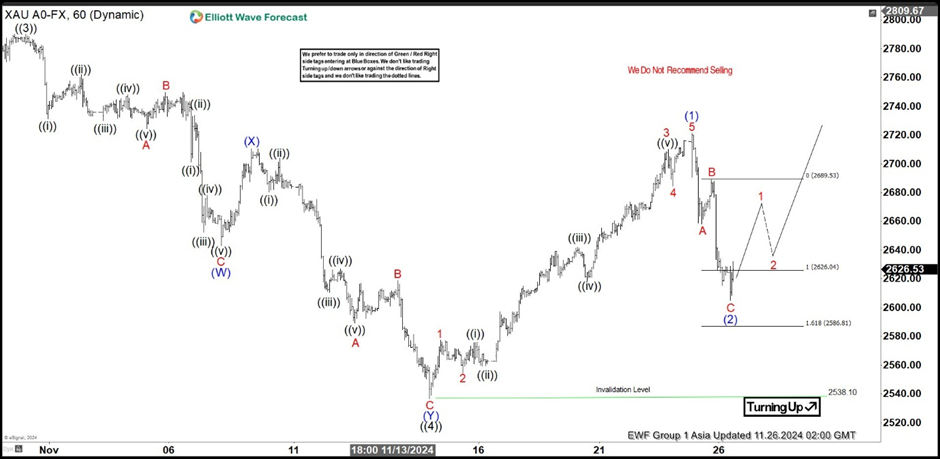
Gold H1 London update 11.26.2024

GOLD ended cycle from the 2538  low as 5 waves structure. The commodity has given us pull back against the 2538  low that unfolded as Zig Zag pattern.  Extreme zone has been already reached at 2626.04-2586.8 ( buying zone) We don’t recommend selling the commodity and expect further rally to resume from the marked area.

Chart

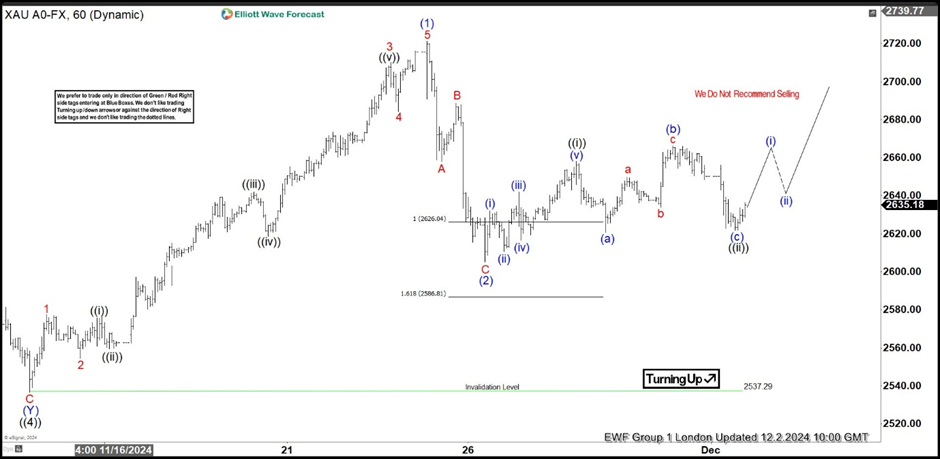
Gold H1 London update 10.24.2023

The commodity has given us nice reaction from the marked extreme zone. Now, as far as the price holds above 2606  low, we can have correction completed and see the further strength. We need to see break above (1) blue – 11.22 high to confirm next leg up is in progress.

Chart

Author

Elliott Wave Forecast Team

Elliott Wave Forecast Team

ElliottWave-Forecast.com

More from Elliott Wave Forecast Team
Share:

Editor's Picks

AUD/USD falls to near 0.7100 after slipping below 50-day EMA

AUD/USD depreciates after registering minor gains in the previous day, trading around 0.7120 during the Asian hours. The technical analysis of the daily chart shows the pair consolidating sideways within a rectangle pattern, as neither bulls nor bears gain control. The AUD/USD pair is holding a slight bearish tone however as it sits beneath both the nine-day and 50-day EMAs.

160.00: USD/JPY back near intervention territory after upbeat US jobs report

US Nonfarm Payrolls beat expectations by a wide margin in May, with 172K jobs added. The US Dollar rebounds after the release, helping USD/JPY recover from its intraday lows. Warnings from Japanese authorities continue to limit upside potential near the 160.00 threshold.

Gold targets $4,300 amid stronger Dollar

Gold faces increasing selling interest and navigates the area of three-month lows near the $4,300 mark per troy ounce on Friday. The precious metal’s decline comes as traders assess the stronger-than-expected NFP, while the bid bias in the Greenback and higher US Treasury yields also collaborate with the retracement.

Cardano hits five-year low even as Hoskinson clarifies "break" isn't an exit

Cardano (ADA) price is down 10% at press time on Friday, extending losses over 30% so far this week amid Charles Hoskinson's clarification that "break" isn't an exit.

Week ahead – Fed countdown begins amid US inflation data and geopolitical risks

Fed Chair Warsh’s first meeting approaches as key US inflation data could reshape expectations. Oil prices remain elevated as US-Iran talks continue; tariffs also return to the spotlight. ECB is expected to hike; will it be a one-off move or is July live?

The US economy defies the rules: 100 days into the Oil shock and the recession signal is still missing

More than three months after the start of the Iran war and the resulting disruption to global energy markets, the US economy continues to display remarkable resilience. The conflict has triggered a sharp rise in Oil prices, reignited inflationary pressures and fueled widespread concerns about a potential economic slowdown.