- Gold price is under pressure on the front side.
- A move to test $1,970 is eyed ahead of $1,950 as per weekly chart structure.
As per the prior week´s pre-open analysis, Gold,of the Week: XAU/USD bulls remain in control, where the Weekly chart´s W-formation had seen the Gold price duck towards the neckline, a bullish phase was anticipated as follows:
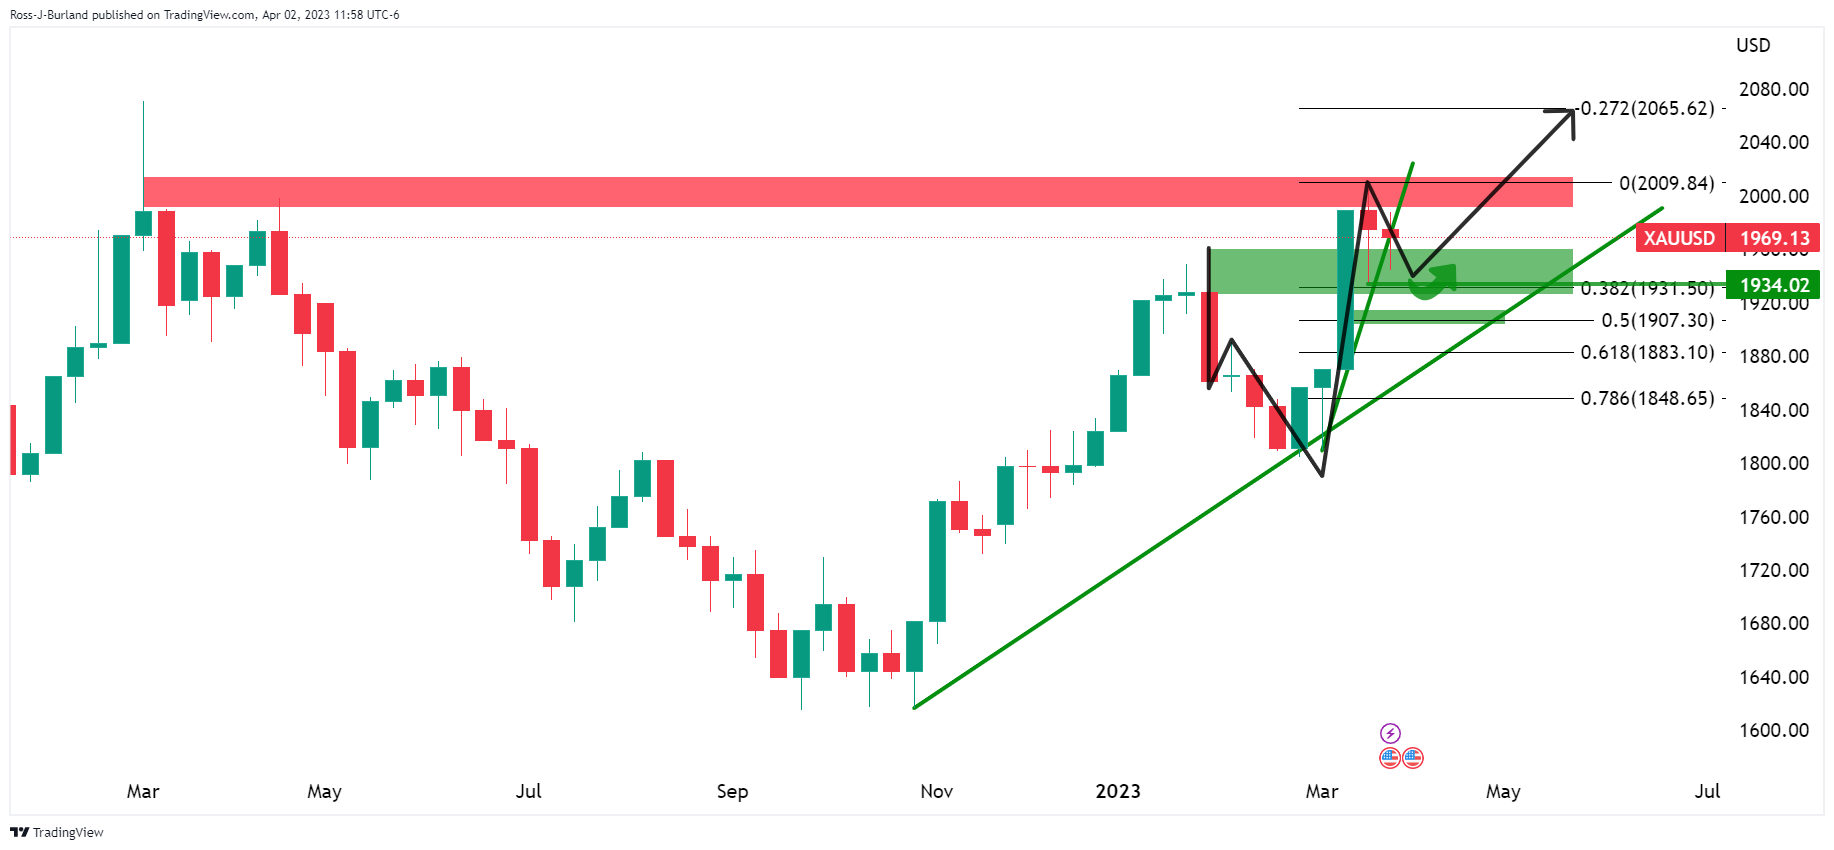
... we got a move into resistance as the ongoing analysis showed:
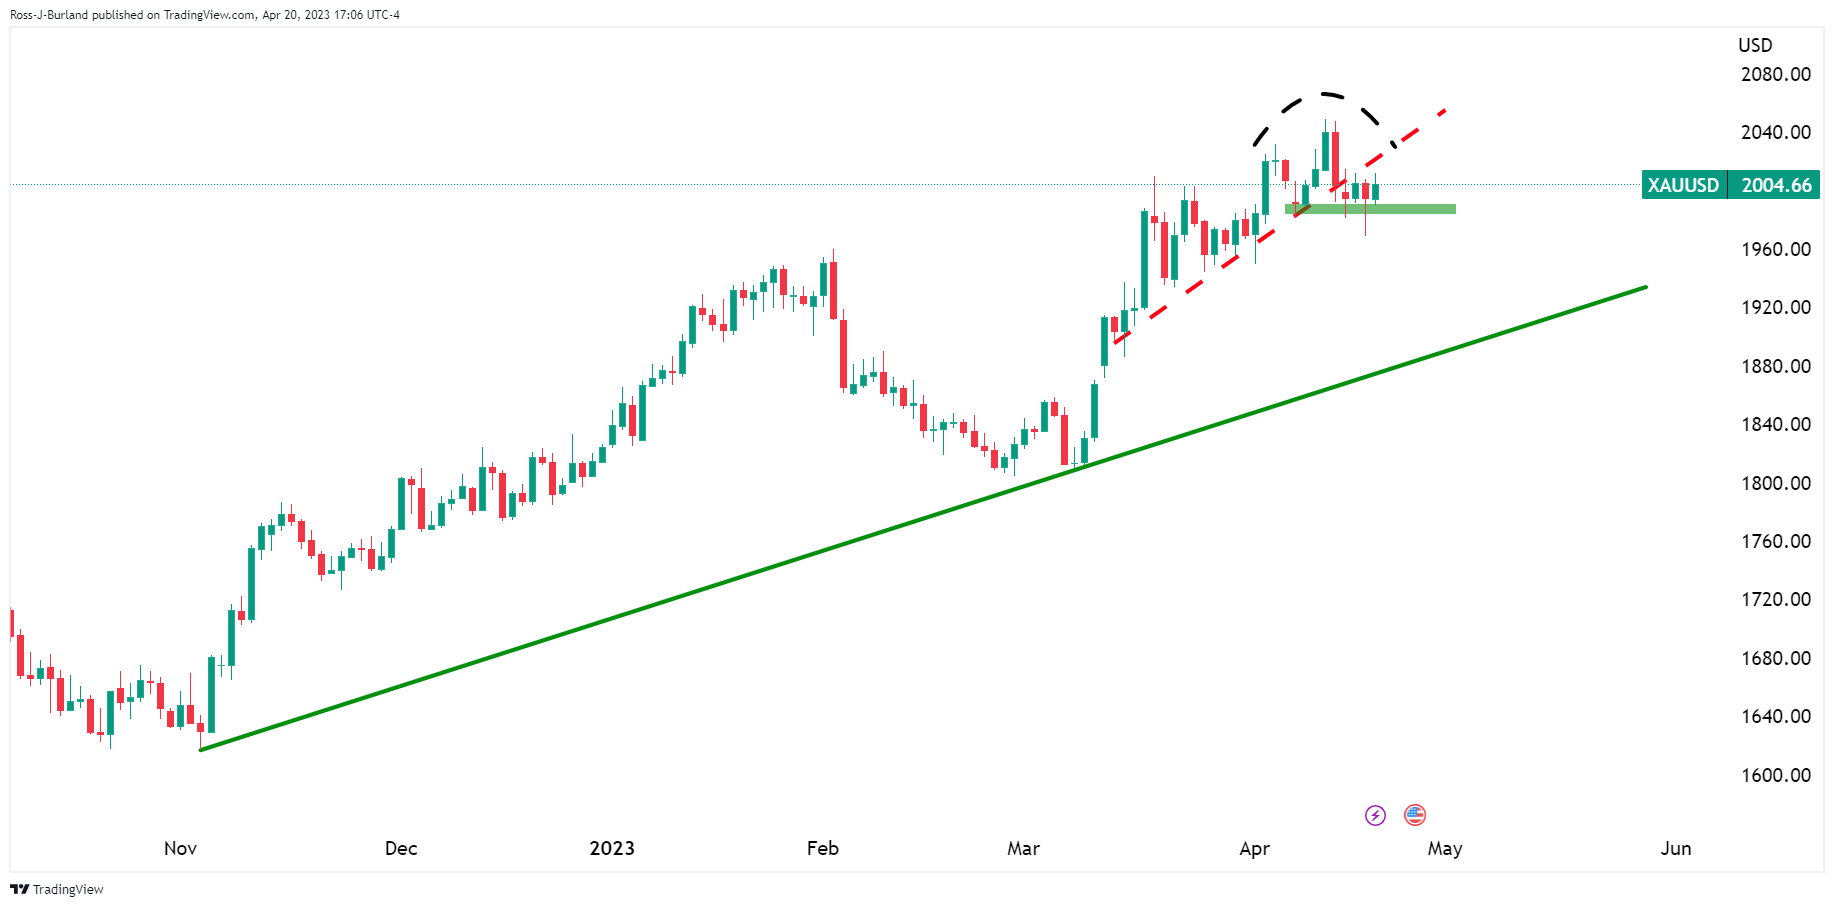
As illustrated above and below, it was then explained that we could have a topping pattern in place for the Gold price:
Gold price H4 chart, prior analysis
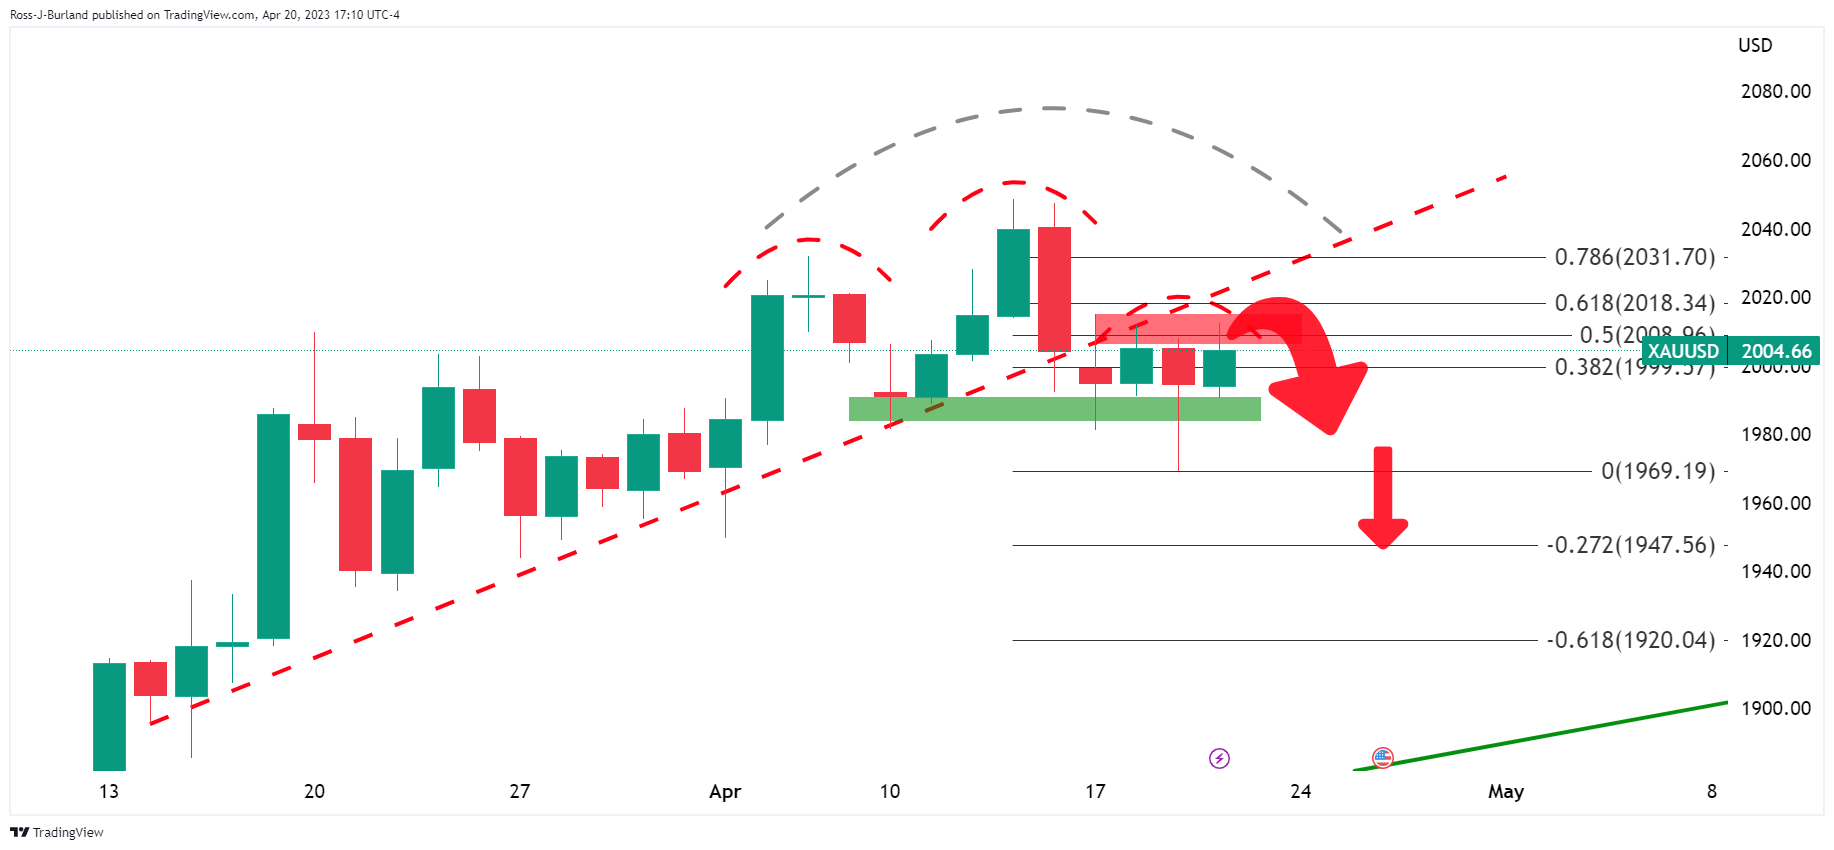
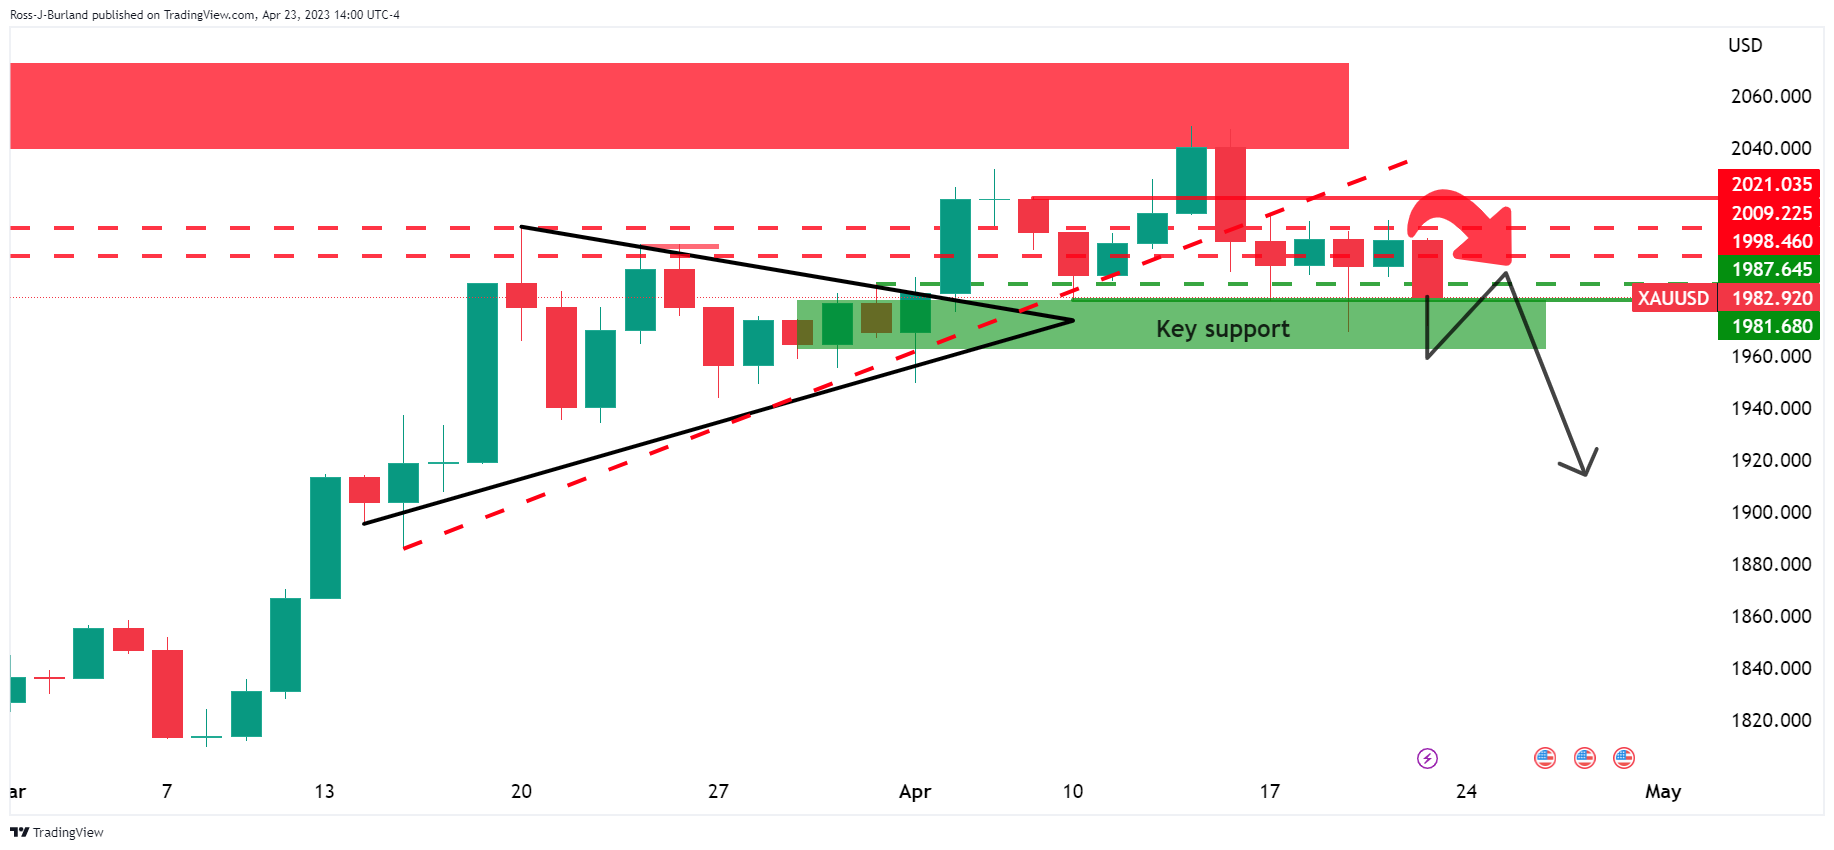
The Gold price had slid to the backside of the trendline support and a break of the neckline horizontal support of the Gold price Head & Shoulders pattern is still needed to switch the bias fully negative from out of the consolidation:
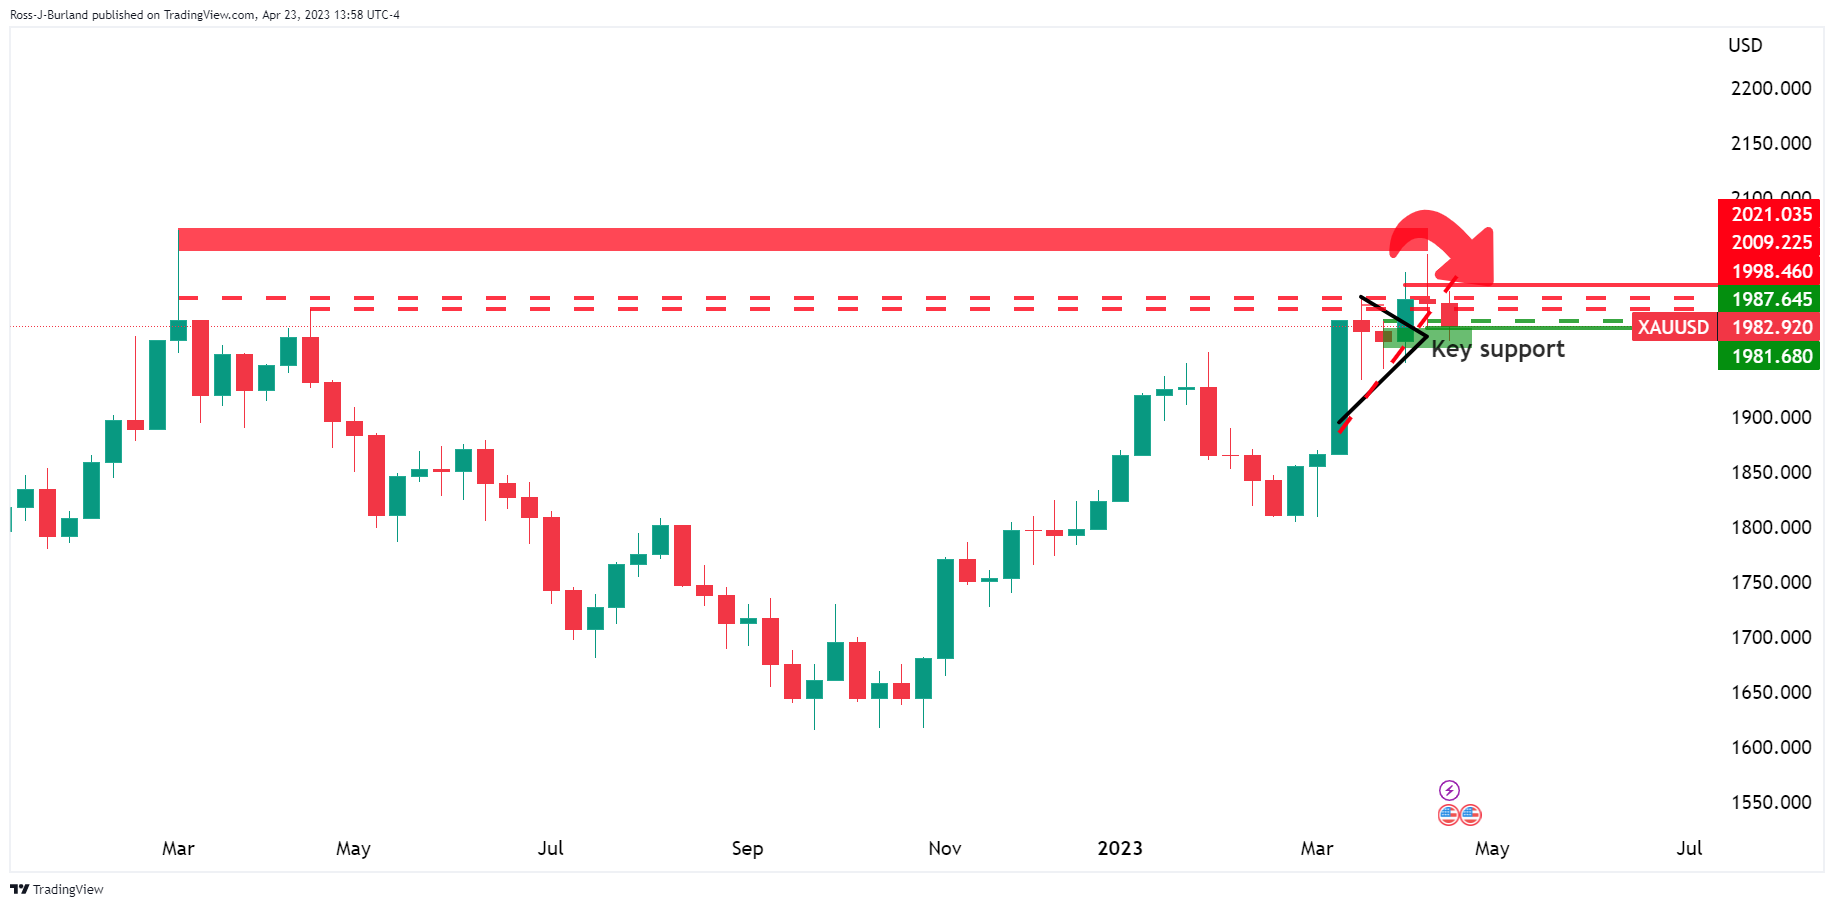
Gold, live updates
(weekly chart)
(Daily chart)
(H4 chart)
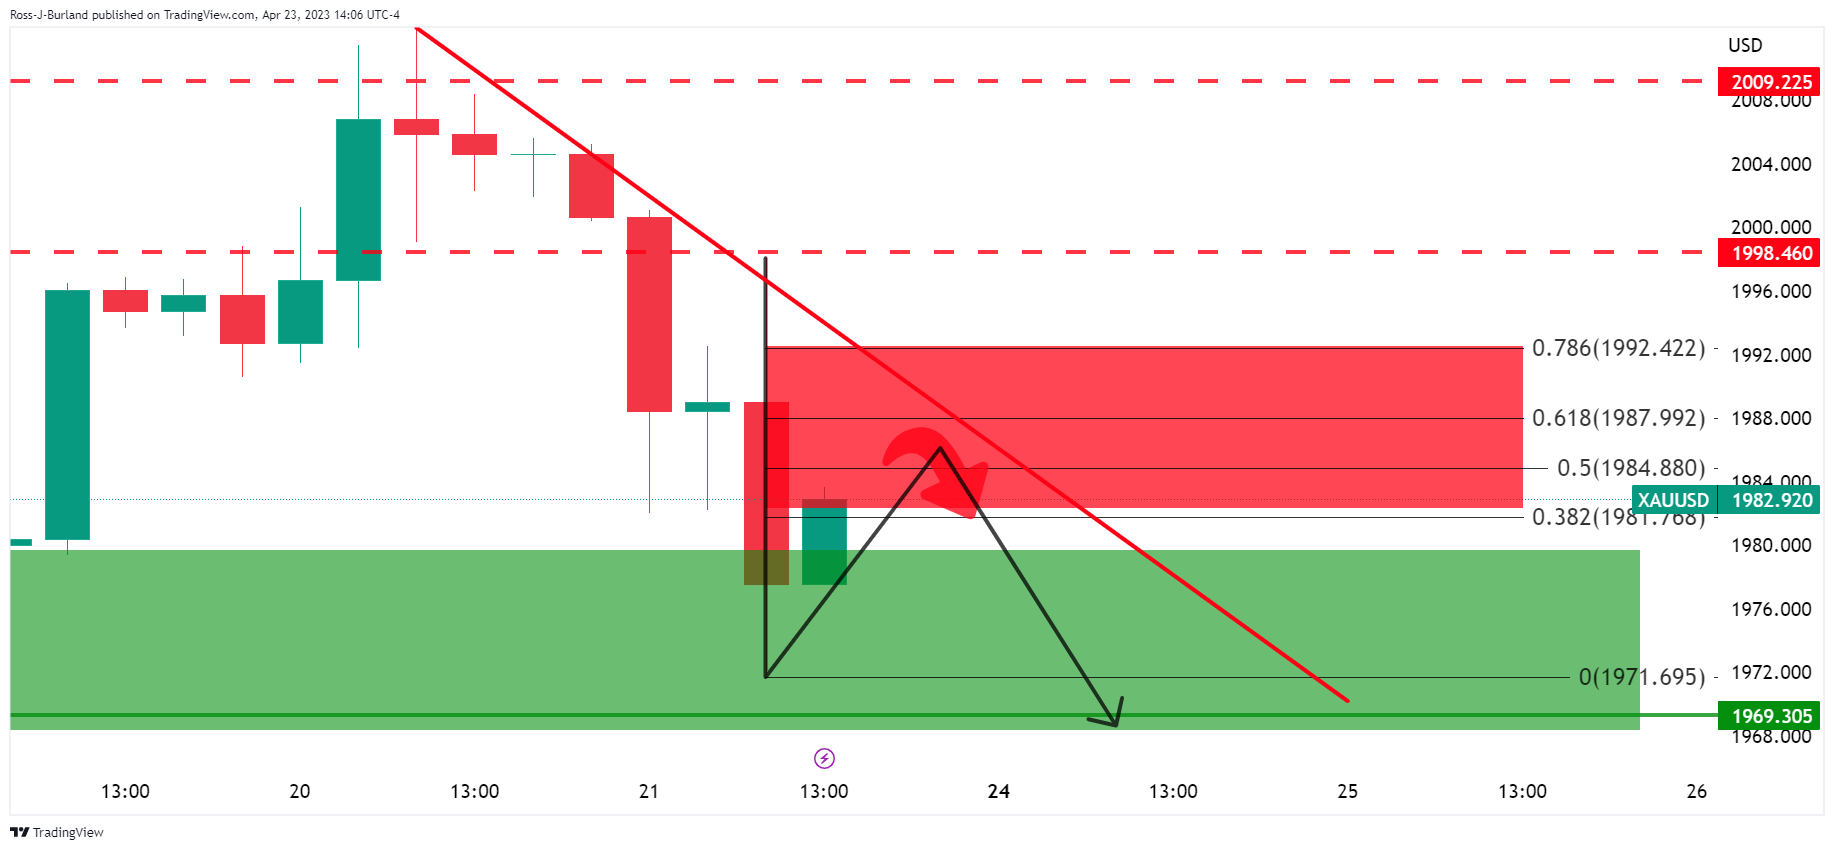
We now have gold meeting support and the price is correcting. So long as the Gold price stays on the front side of the bearish trendline, the correction is going to struggle to maintain momentum and $1,970 will be eyed as the next key target for the bears.
From a fundamental perspective, analysts at TD Securities explained that continued hawkish talk from the US FOMC members and unexpectedly firm economic data have convinced traders that the US central bank may not pivot to a dovish policy stance anytime soon.
´´With yields moving higher across the yield curve and a firmer dollar, many managers went short; this turned out to be the correct call as the yellow metal is some $66 off the $2,048/oz high at the time of writing,´´ the analysts explained.
´´Given US economic data continues to come in strong with the Fed likely hiking rates in May, prices may still drop further to support levels near $1,962/oz. This would be in line with our Q2 forecast of $1,975/oz,´´ the analysts concluded.
Information on these pages contains forward-looking statements that involve risks and uncertainties. Markets and instruments profiled on this page are for informational purposes only and should not in any way come across as a recommendation to buy or sell in these assets. You should do your own thorough research before making any investment decisions. FXStreet does not in any way guarantee that this information is free from mistakes, errors, or material misstatements. It also does not guarantee that this information is of a timely nature. Investing in Open Markets involves a great deal of risk, including the loss of all or a portion of your investment, as well as emotional distress. All risks, losses and costs associated with investing, including total loss of principal, are your responsibility. The views and opinions expressed in this article are those of the authors and do not necessarily reflect the official policy or position of FXStreet nor its advertisers. The author will not be held responsible for information that is found at the end of links posted on this page.
If not otherwise explicitly mentioned in the body of the article, at the time of writing, the author has no position in any stock mentioned in this article and no business relationship with any company mentioned. The author has not received compensation for writing this article, other than from FXStreet.
FXStreet and the author do not provide personalized recommendations. The author makes no representations as to the accuracy, completeness, or suitability of this information. FXStreet and the author will not be liable for any errors, omissions or any losses, injuries or damages arising from this information and its display or use. Errors and omissions excepted.
The author and FXStreet are not registered investment advisors and nothing in this article is intended to be investment advice.
Recommended Content
Editors’ Picks
EUR/USD extends losses on dovish remarks from ECB members, trades near 1.0780
EUR/USD continues its downward trend for the fourth consecutive day, driven by a stronger US Dollar influenced by the hawkish market sentiment surrounding the Federal Reserve and expectations of prolonged higher interest rates.
GBP/USD trades sideways above 1.2600 amid quiet session
The GBP/USD pair trades sideways around 1.2622 during the early Friday. The market is likely to be mute in light trading on Good Friday. Later in the day, the US Core Personal Consumption Expenditures Price Index will be released.
Gold ends Q1 2024 at record highs, what’s next?
Gold is sitting at an all-time high of $2,236, lacking a trading impetus amid holiday-thinned conditions on Good Friday. Most major world markets, including the United States are closed in observance of Holy Friday, leaving volatility around Gold price highly subdued.
Ripple's move above this key level could trigger nearly 50% rally for XRP
Ripple price has overcome a critical resistance level and flipped into a support floor on the weekly time frame. This development happened while XRP tightly consolidated for roughly 250 days. As this coiling up comes undone, investors can expect XRP to kickstart a massive rally.
Will they won’t they cut rates is the question of Q2?
There has been some significant push back from Fed and Bank of England members around the timing of rate cuts, and the Bank of Japan still haven’t physically intervened in the FX market to stem yen weakness although they are threatening to do so.