Gold, Chart of the Week: Bulls pining for $1,850+, could be just a Fed away
- Gold could be on the verge of a significant move to the upside.
- Fed week is a major risk for the US dollar and US yields could be on the verge of a technical meltdown.

This is going to be a critical week for both the US dollar and precious metals, with gold taking the spotlight in that space. The bulls have had a good run at the start of this year as investors questioned whether real rates can rise enough to really hinder the yellow metal's appeal.
For the week ahead, investors will be able to generate more clues in this regard. The Federal Reserve's interest rate decision, the Federal Open Market Committee's statement and the Fed chair's press conference are expected to be impactful.
With four interest rate hikes already priced into the markets, the focus on the Fed's balance sheet at Wednesday’s meeting could well see a shift in the pricing of the Fed's terminal rate. If this were to decline or even reverse, then the market's long positioning in gold would be expected to increase, boosted by a decline in the US dollar, albeit a modest one.
With that being said, traders will need to pay close attention to US Gross Domestic Product and especially the fourth quarter Employment Cost Index on Friday. That is to say, investors will be keen to see how the inflationary effects are making their way through into the labour market.
Meanwhile, the technical outlook is building more and more bullish by the day in gold, but the reluctance in the dollar to stay down has to be taken into consideration. On the other hand, the 10-year yield's weekly chart is a compellingly bearish scenario as follows:
US 10Y, weekly chart
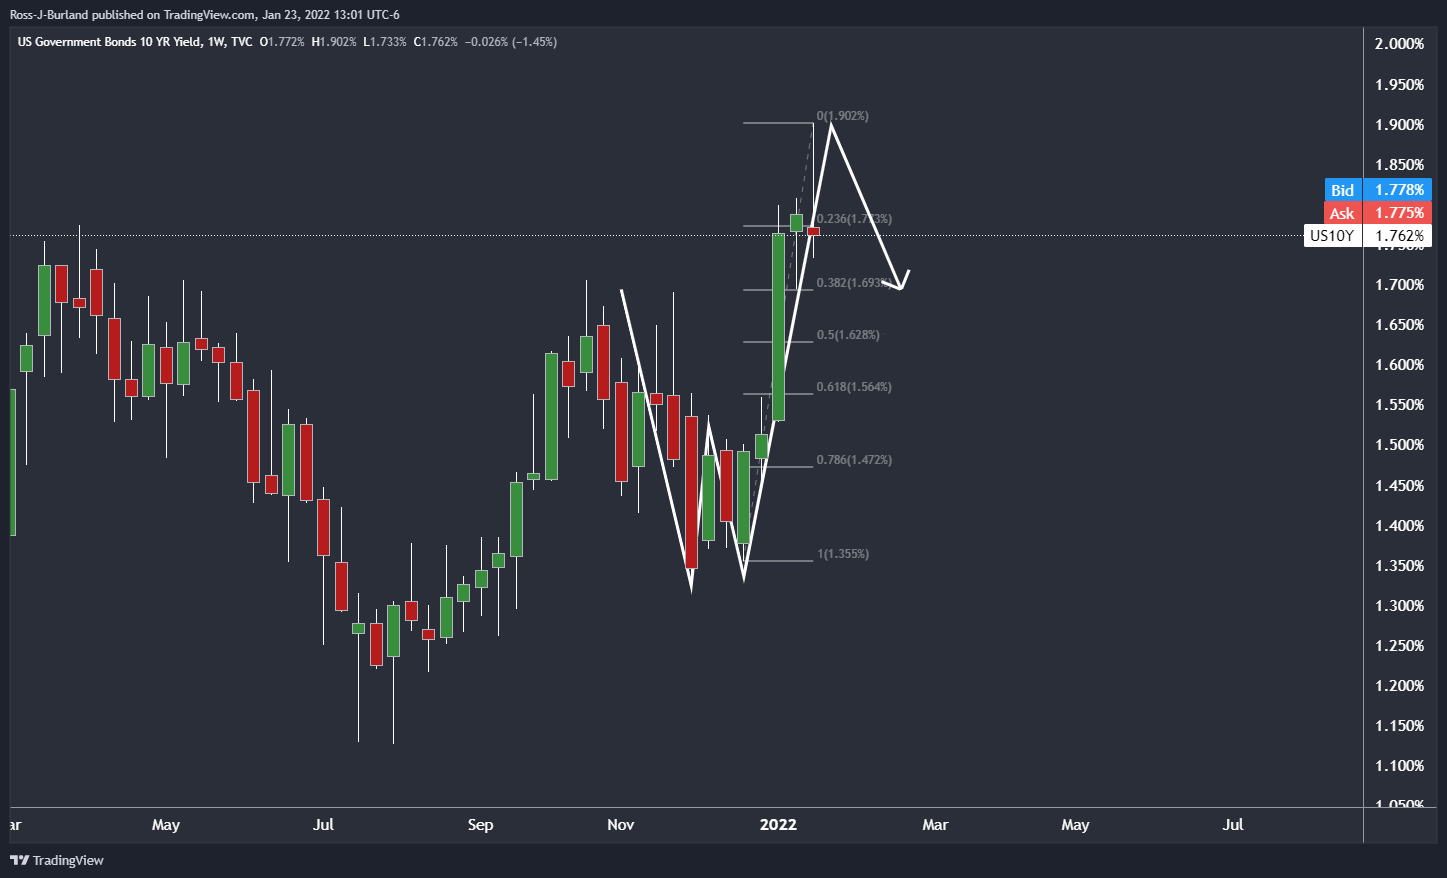
What is being shown here is a W-formation. This is a reversion pattern that has a high completion rate on a fractal basis, meaning all time frames. The price tends to retrace back to the neckline of the formation, or, in the case of an overextended W, such as above the price tends to revert back to the old structure and confluence levels. In this scenario, the 38.2% Fibonacci aligns with the prior highs around the 1.70s%.
DXY, daily chart
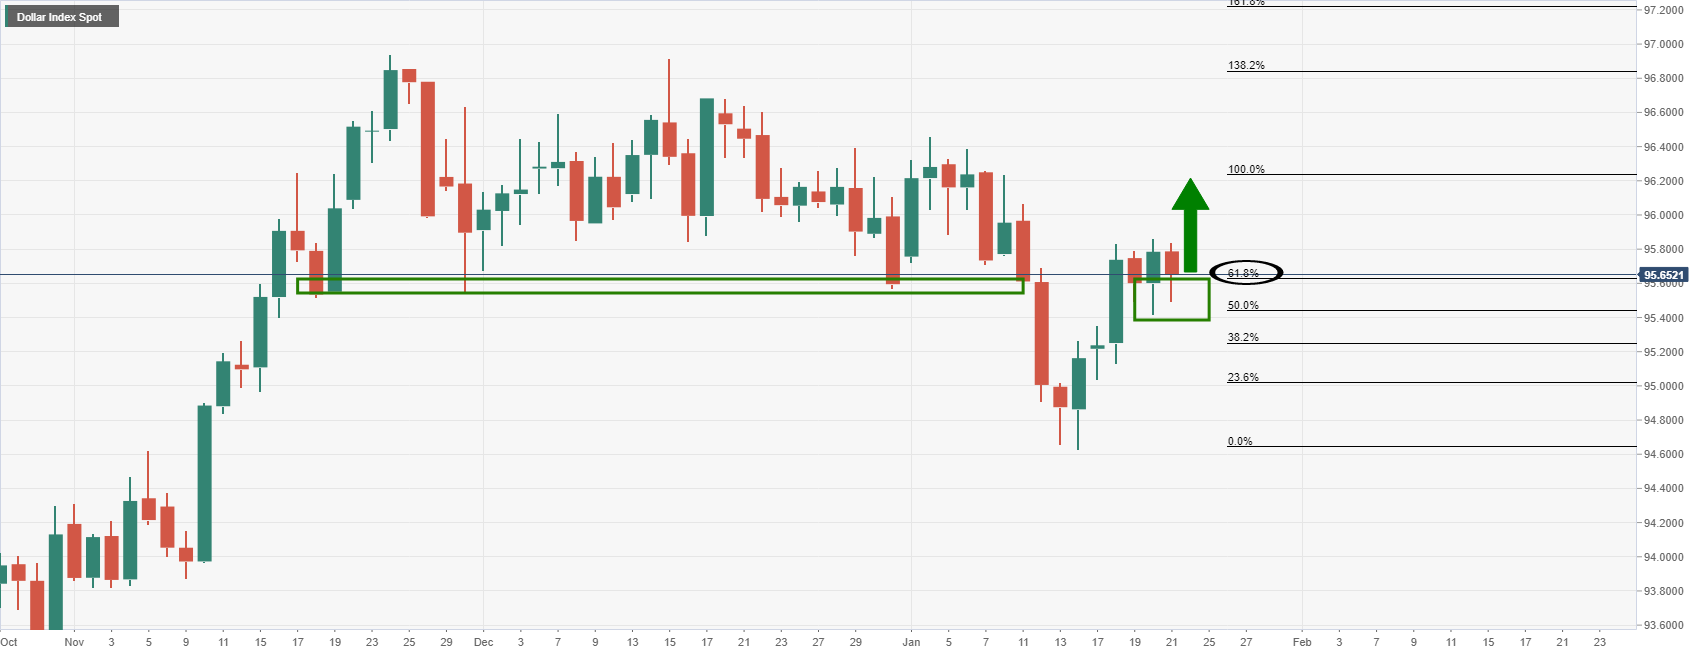
However, when taking into account the US dollar's recent performance, it is hard to make a bearish conclusion when the bulls are in charge and holding the price above the 95.40's. Despite the drop below the long-term daily support in the 95.50's, the price has shot back into the sideways channel.
On the other hand, there is some resistance being seen here and Wycoff enthusiasts might term the price drop as the breakout of a phase of distribution. What we could be seeing here is merely the retest in a low volume rally before the markdown, aka a much lower low. The weekly chart is compelling in this regard:
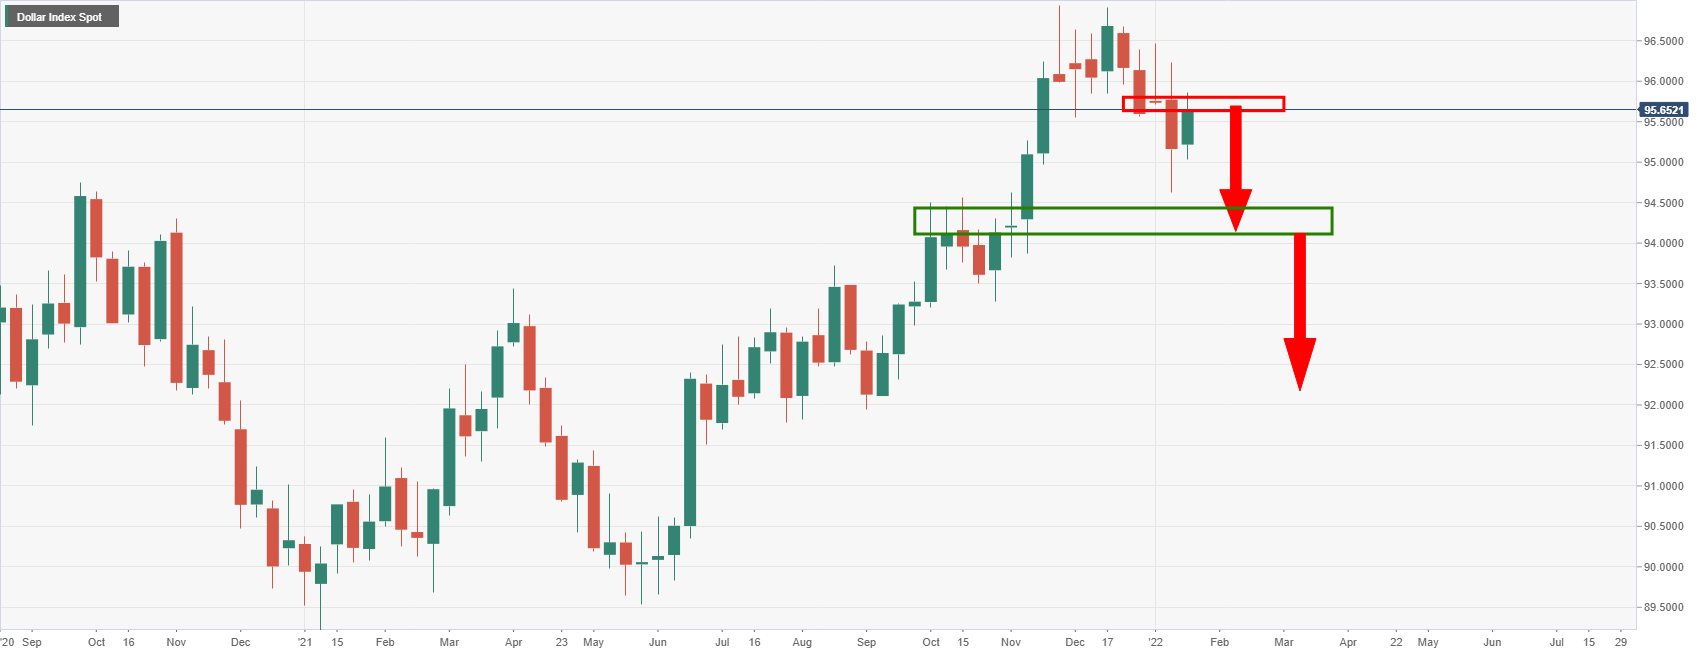
We are seeing a retest of the distribution zone's lows which could lead to a markdown towards old highs near 94.50 and then a retest of 92 on the longer-term outlook.
Gold daily chart
As per last week's analysis, Gold, Chart of the Week: Bearish confluences below $1,830, the price of gold was held up at the daily chart's W-formation's neckline:
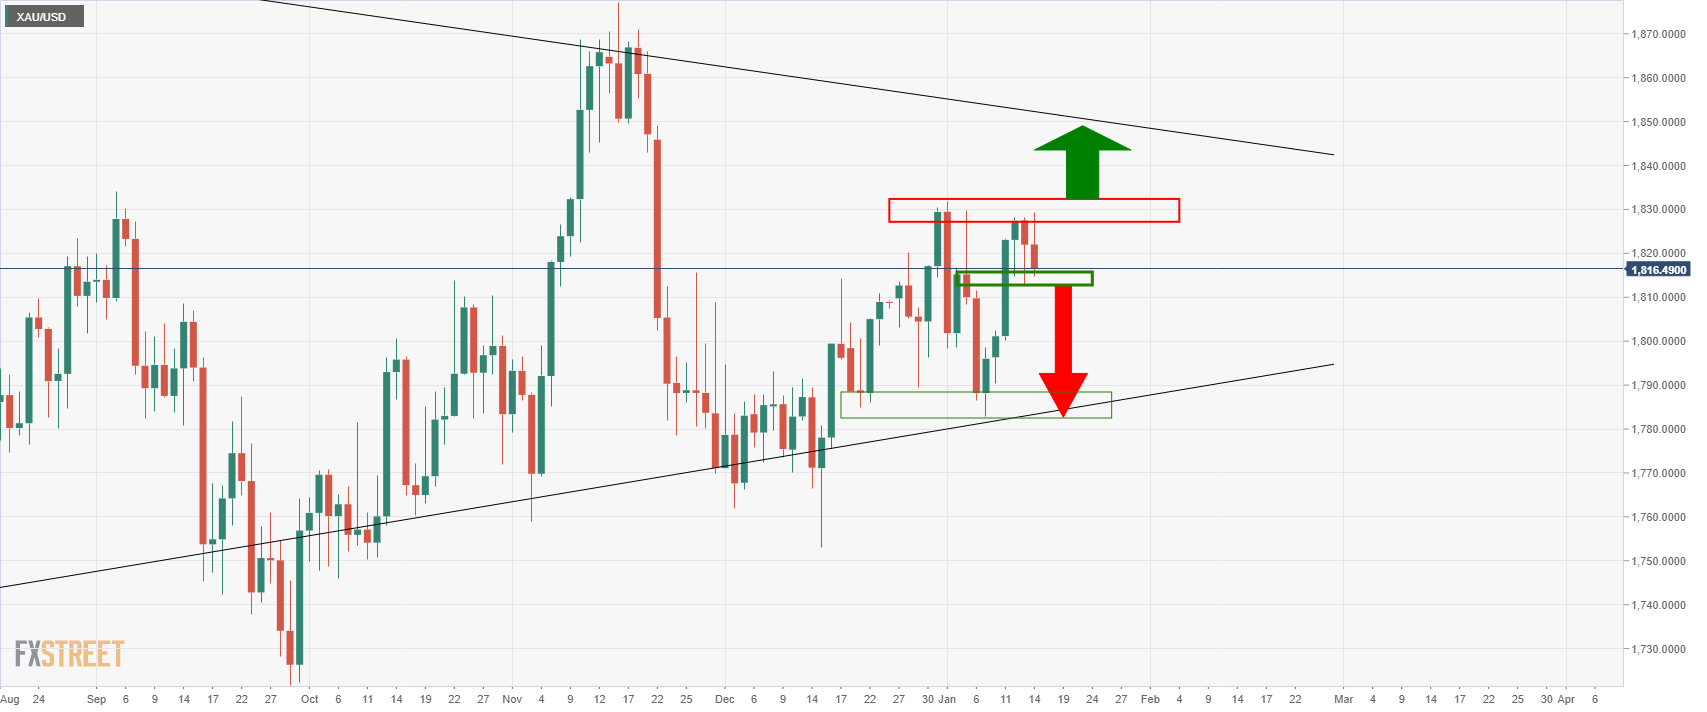
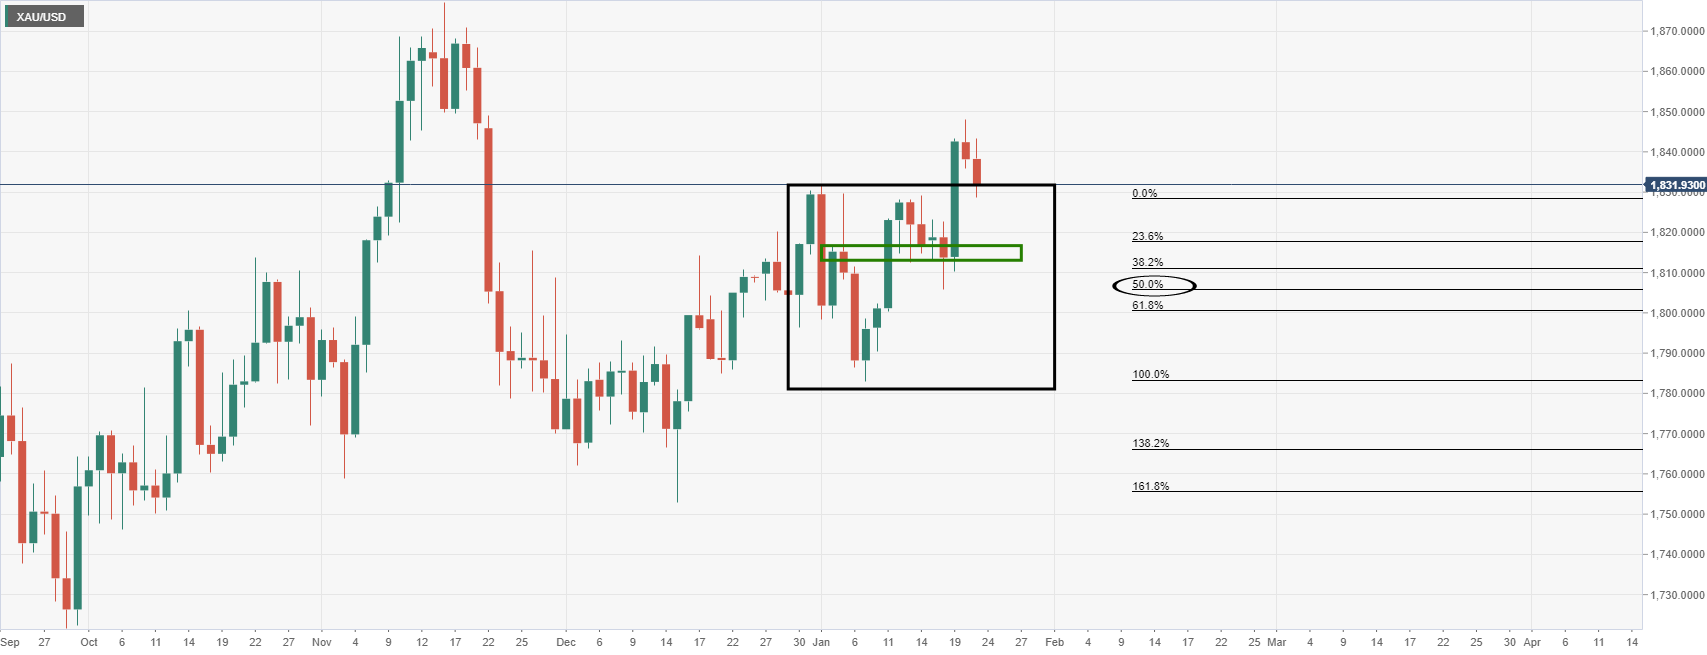
After 50% mean reversion, the price has penetrated the critical resistance instead of revisiting the trendline line support and that could be significant for the path to the psychological $1,850 mark for this week's open.
The price has just made another 50% mean reversion:
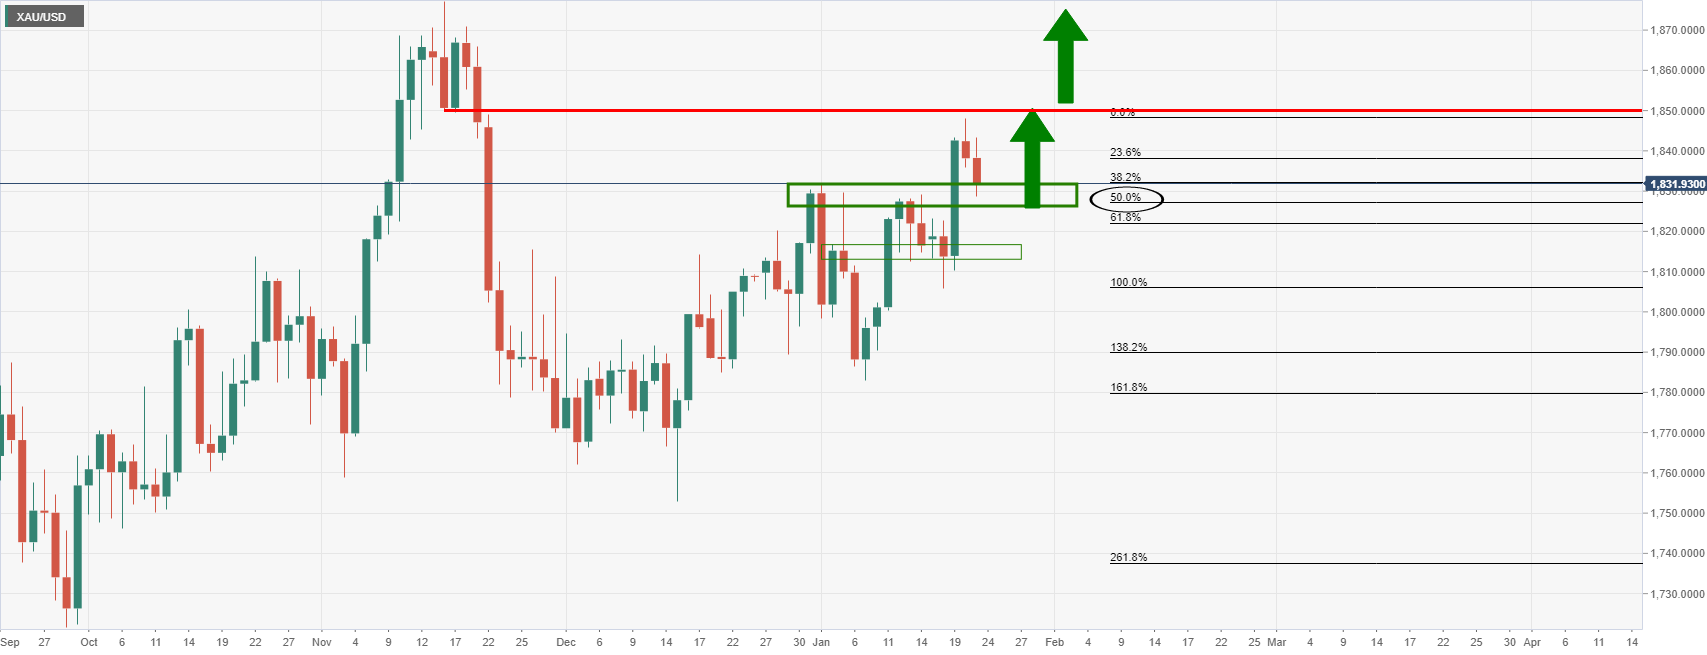
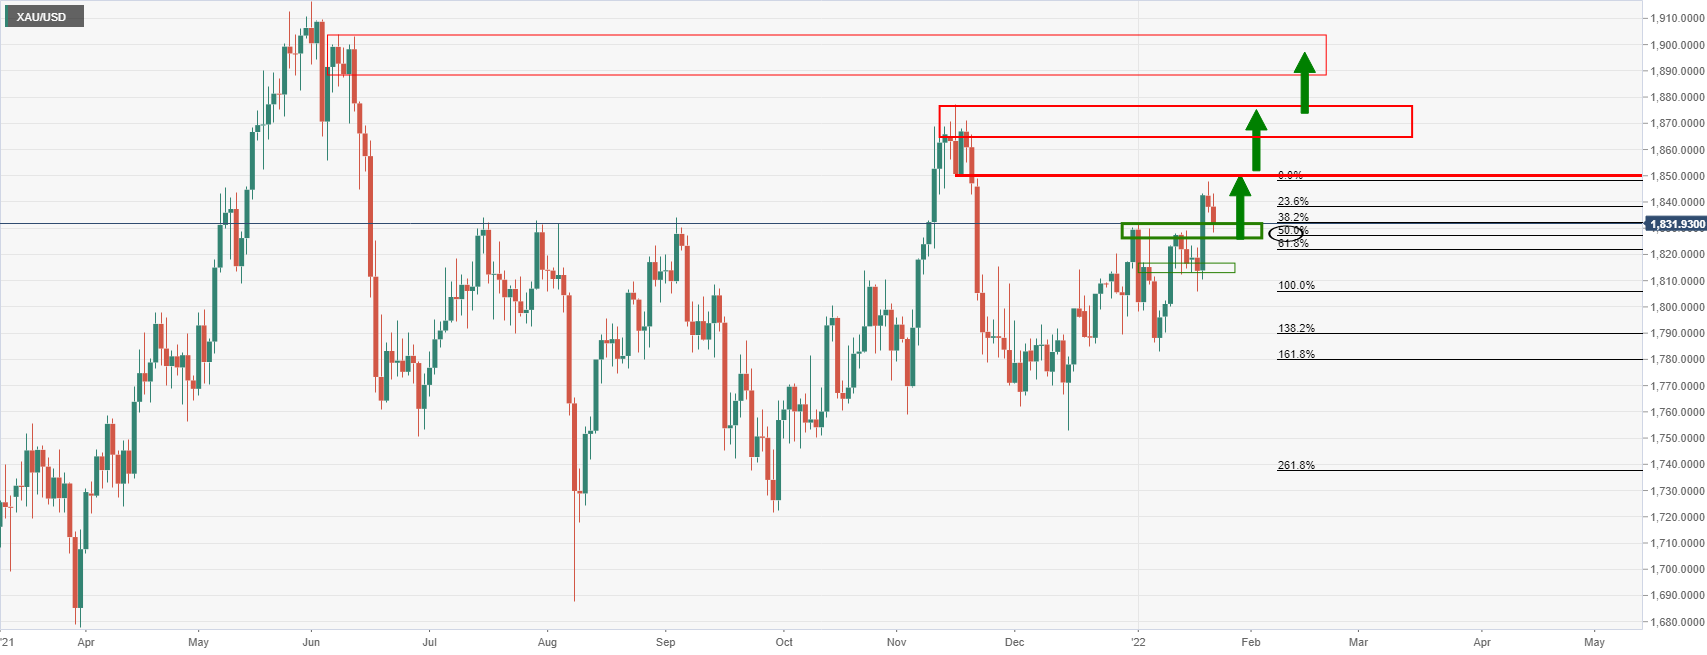
While some deceleration of the price's correction and sideways consolidation into the critical Fed event this week could be in order, should the support hold, then a burst through $1,850 would be expected to see the bulls in good stead towards the $1,870's as last major defence for the $1,900s:
Author

Ross J Burland
FXStreet
Ross J Burland, born in England, UK, is a sportsman at heart. He played Rugby and Judo for his county, Kent and the South East of England Rugby team.


