|premium|

Gold, Chart of the Week: Bearish confluences below $1,830

  • Gold bears are out and a break of $1,800 opens risk to the $1,780s.
  • Bulls would argue that real rates will increase only modestly.

Gold can be analysed from a bearish perspective as per the following top-down analysis. This rhymes with the hawkish signals coming from the Federal Reserve and the market expectations suggesting a March Fed funds hike is imminent. Investors have extended short positioning and sold longs with yields across the curve moved convincingly higher.

Gold monthly chart

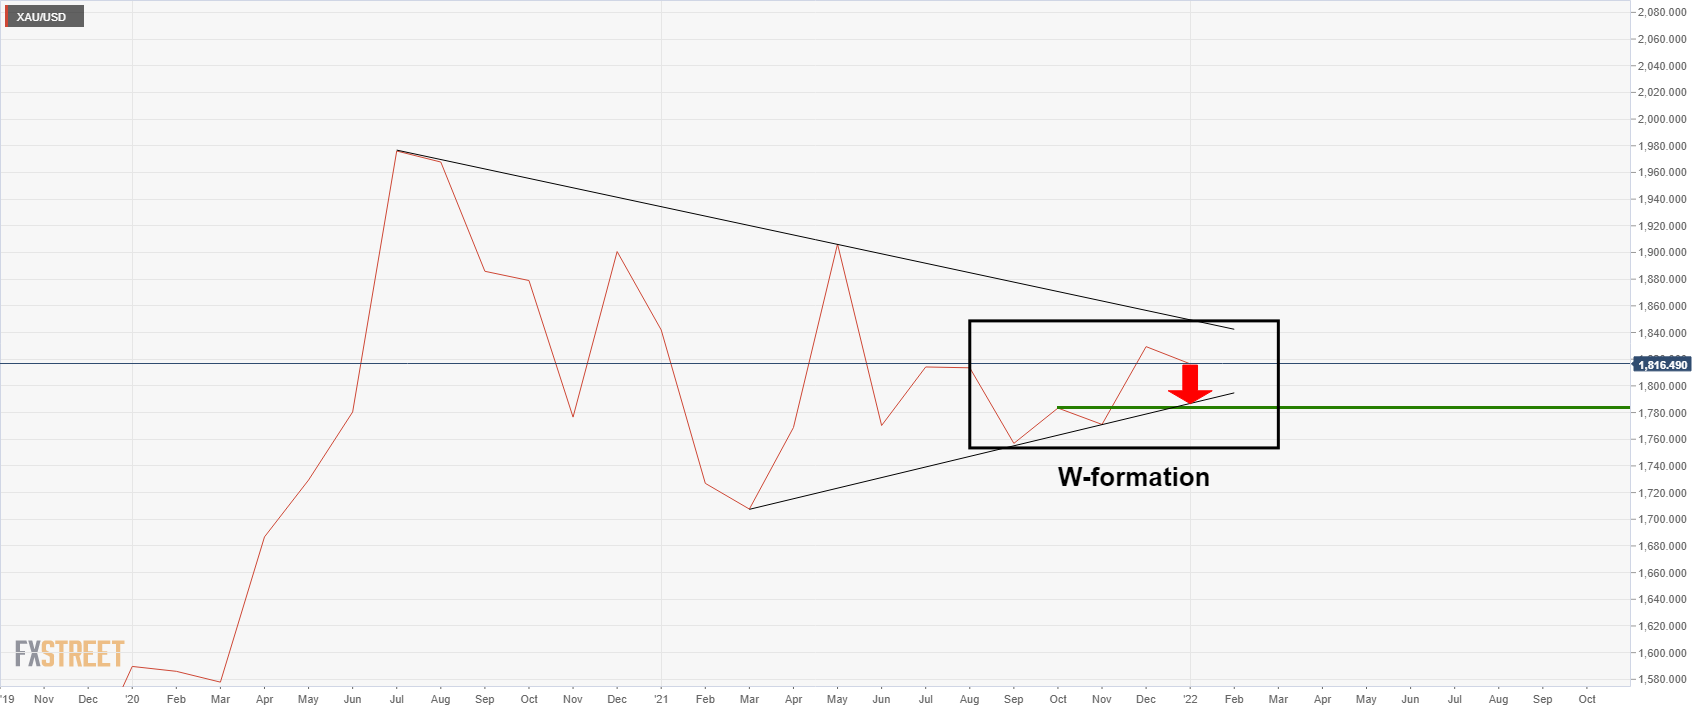
The monthly W-formation is a bearish reversion pattern where the neckline comes in at $1,783 with a confluence of the dynamic support line. 

Gold weekly chart

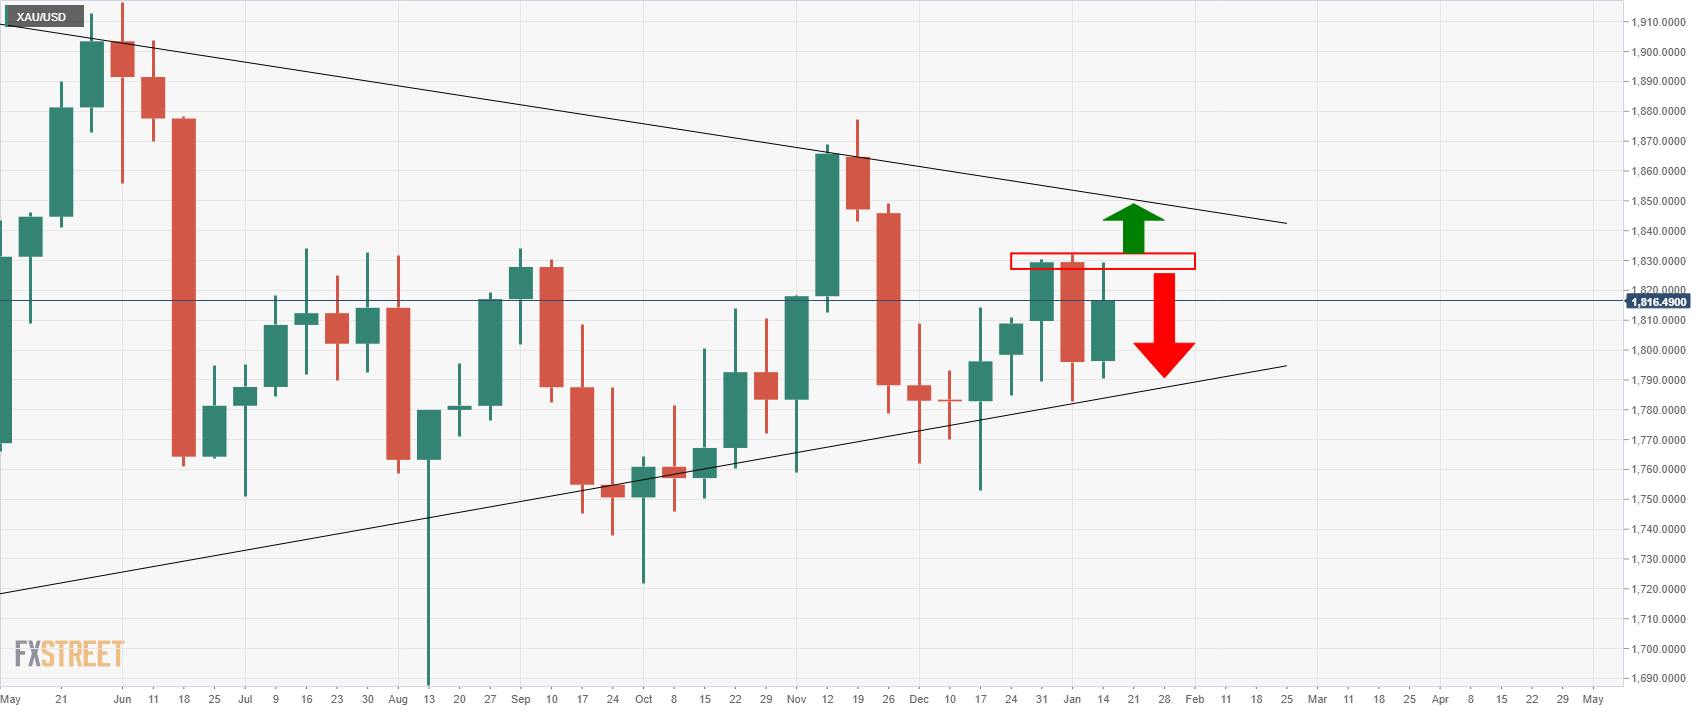
The weekly chart is showing that gold is struggling to break the prior double highs and a failure again last week makes for a bearish triple top. 

Gold daily chart

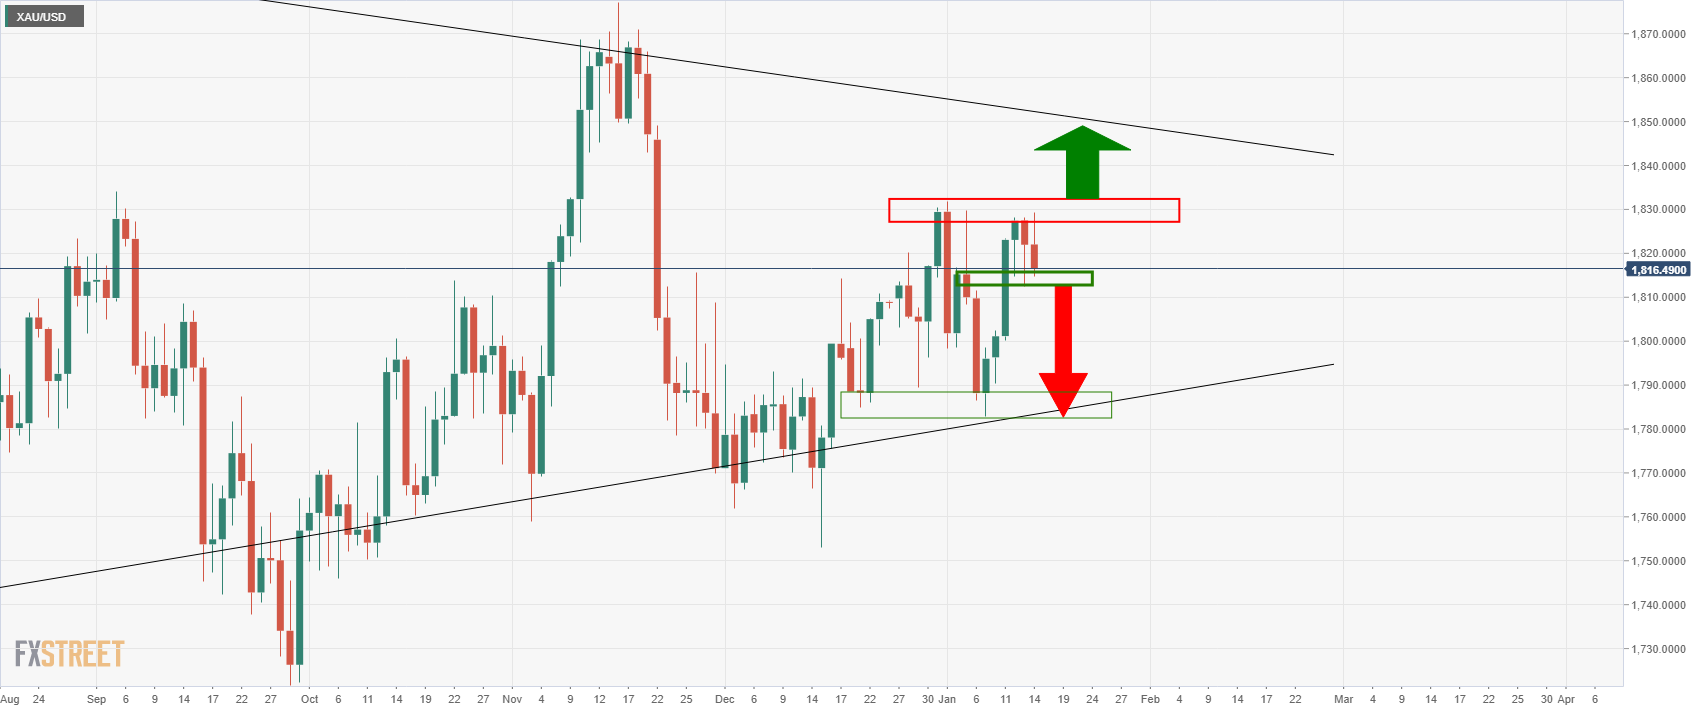
The daily chart is pressuring the W-formation's neckline near $1,815 which guards a deeper test of the bullish impulse's range between $1,782.93 and $1,828.11. The low meets the trend line support, so a break there would be significantly bearish. 

Gold 4-hour chart

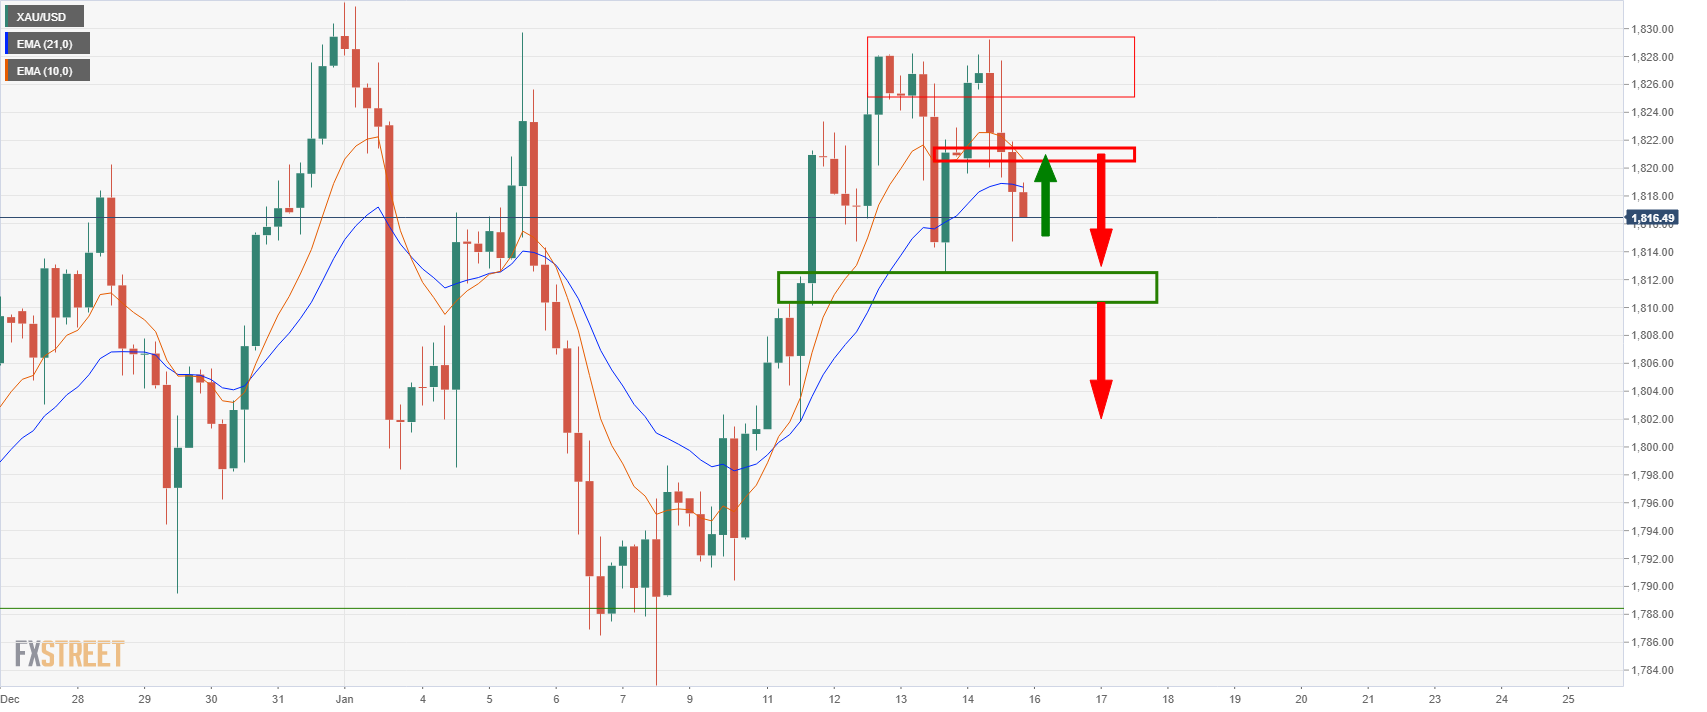
The 4-hour chart sees the price on the back foot but a correction could be on the cards for the open in what would be a retest of the $1,821 structure. No matter which way, the outlook is bearish and there are prospects of a move into the depths of the $1,800s to meet the $1,801 prior low. However, a break above $1,829 and a close in the $1,830's would negate the bearish outlook. 

Additionally, the Federal Reserve chairman Jerome Powell was telling the Senate Banking Committee last week that he is keen to fight inflation, but he also implied a very measured course of action. As analysts at TD securities argued, ''this implies that real rates will increase only modestly and that gold may jump higher as shorts cover.'

Premium

You have reached your limit of 3 free articles for this month.

Start your subscription and get access to all our original articles.

Subscribe to PremiumSign In

Author

Ross J Burland

Ross J Burland, born in England, UK, is a sportsman at heart. He played Rugby and Judo for his county, Kent and the South East of England Rugby team.

More from Ross J Burland
Share:

Editor's Picks

AUD/USD eyes 0.7150 barrier nine-day EMA

AUD/USD inches higher after registering modest losses in the previous day, trading around 0.7130 during the Asian hours. The technical analysis of the daily chart indicates that the pair is moving sideways within the rectangle pattern, suggesting a consolidation as neither the bulls nor the bears have enough momentum to take control of the market.

USD/JPY trades below 160.00 intervention threshold; bullish bias intact

The USD/JPY pair attracts some sellers during the Asian session amid fears that authorities will step in again to prop up the Japanese Yen. Furthermore, the Israel-Lebanon truce prompts some profit-taking around the US Dollar and exerts downward pressure on the currency pair.

Gold puts its 200-day SMA to the test near $4,420

Gold keeps the bullish stance in place in the latter part of Thursday’s session, although a convincing break above the key $4,500 mark per troy ounce still remains elusive. The precious metal’s advance comes amid the resurgence of some selling interest around the Greenback, improving risk sentiment, and declining US Treasury yields across the board.

Bitcoin’s massive storm is back: Why the sell-off is far from over

Bitcoin price action over the last few weeks has felt less like a normal, healthy correction and more like a slow grinding crash that continues to wreak havoc on holdings and trading accounts. And everything suggests that the dramatic crash isn’t over.

Nonfarm payrolls: Testing the limits of Fed policy patience

The upcoming nonfarm payrolls report for May will provide the final update on the US labor market before Kevin Warsh attends his first policy meeting as the new Fed Chair later this month.

Recession on paper: What really moves the Canadian Loonie now?

Statistics Canada handed the headline writers a gift and the analysts a headache. Real GDP shrank 0.1% on an annualized basis in the first quarter, and with the fourth quarter of 2025 revised down to a 1.0% contraction, that is two negative quarters in a row, the textbook definition of a technical recession and Canada's first since the pandemic.