Gold and the US elections

The upcoming US election and Gold’s record highs
Voters in the United States (US) head to the polls on 5 November to elect their next president. The 60th US Presidential election is shaping up to be a tightly contested race between Kamala Harris and Donald Trump, with current polls unable to point to a clear-cut winner. In the midst of ongoing campaign efforts, Gold has remained a clear outperformer, garnering global attention from both investors and market commentators.
Candidates neck-and-neck as election day nears
According to ABC News/538’s latest national polling averages, as of 22 October, Harris maintains a narrow lead over Trump with 48.1% vs 46.4%. Additionally, a poll published by The Washington Post on Monday revealed that approximately 47% of registered voters would ‘definitely’ or ‘probably’ vote for Harris, while 47% stated the same for Trump.
The races in the battleground states – Pennsylvania, Michigan, Wisconsin, North Carolina, Georgia, Nevada, and Arizona – are particularly intense, with no candidate maintaining a decisive lead. According to ABC News, the margin between Trump and Harris is two percentage points or less in all seven major swing states.
Pennsylvania, with its 19 electoral votes, is a crucial battleground that could determine the outcome of this year’s election. With nine million registered voters, the state typically leans Democratic, having voted for the winner in every presidential election since Barack Obama in 2008. In 2016, Donald Trump won Pennsylvania by just 45,000 votes, while Joe Biden secured the state in 2020 with a margin of approximately 90,000 votes, translating into a one-percentage-point victory.
Quantus Insights’ latest Pennsylvania survey, conducted between 17 and 20 October, again points to a very tight race, with Trump leading Harris by two-percentage points (50% vs 48%). The upcoming days will be crucial as both candidates ramp up their campaigns in the swing states, which may ultimately shape the election's outcome.
Increased uncertainty, Gold as a safe haven
US elections are unquestionably among the most significant events for global financial markets. The occupant of the White House directly influences the direction of the US's economic, fiscal, and monetary policies, as well as its foreign relations – factors that are key drivers of market sentiment.
Amid growing uncertainty surrounding the US election outcome, gold – a widely recognised safe-haven asset – reached record highs of $2,758 per ounce. This surge is supported by escalating tensions in the Middle East and expectations of further policy easing from the US Federal Reserve, with investors currently pricing in 44 basis points of rate cuts by year-end.
Historical relationship between Gold, politics and economic landscape
Fluctuations in the price of Gold are nothing out of the ordinary for markets and investors. While Gold prices often experience shifts during US election periods, geopolitical events and economic indicators – particularly inflation and unemployment metrics – along with changes (or expectations of a change) in interest rates also impact the price of the yellow metal and its appeal as a safe haven.
During Jimmy Carter's presidency from 1977 to 1981, the price of Gold increased by an impressive 326%. In contrast, while Ronald Reagan was in office from 1981 to 1989, the price of the precious metal dropped by 26%. Some analysts argue that the price spike during Carter’s term was a continuation of an upward trajectory which began in 1971 when President Richard Nixon terminated the Gold standard (i.e., the direct international convertibility of the US dollar to Gold) in response to increasing inflation, as well as geopolitical uncertainty brought on by the Cold War.
As the US economy recovered and negotiations began with the Soviet Union during the Reagan administration, the price of Gold decreased by almost 50% between the start of his first and second terms.
When Barack Obama left the White House in 2017, the prices of Gold and Silver were up by 40% and 50%, respectively, compared to when he took office eight years earlier. Following concerns over the US debt ceiling and fears of the government defaulting on its debt obligations in 2011, Gold surged to US$1,895 – 122% higher than Obama’s first day as president.
During Donald Trump’s presidency, and given the economic fall out of the Covid-19 pandemic, the precious metal’s price hit an all-time high of over US$2,000 in August 2020, marking a 72% increase from his first day in office.
Gold bulls continue to outperform despite overbought signals
Gold has powered higher this year, climbing 34% year to date and recently refreshing all-time highs of US$2,758. The precious metal is on track to pencil in its largest one-year gain in 14 years.
While Gold’s rise is noteworthy, longer-term action signals trouble could be ahead. The monthly chart’s Relative Strength Index (RSI) is closing in on an area of resistance between 87.02 and 83.87; historically speaking, the momentum oscillator has turned south every time it has reached this zone since 2008.
Another technical observation worth considering on the monthly scale is the convergence of projection ratios at current price. At US$2,723, a 100% projection ratio is present (harmonic traders will recognise this as an AB=CD resistance pattern), which is closely connected with a 1.272% Fibonacci projection ratio at US$2,777 (an ‘alternate’ AB=CD resistance).

Chart created using Tradingview
Meanwhile, price action on the daily chart shows that Gold is colliding with channel resistance, extended from the high of US$2,531. In addition to potential resistance forming on the monthly timeframe between US$2,777 and US$2,723, adding weight to the daily ascending line is the possibility of a negative divergence signal from the RSI on the daily chart.
The combination of monthly and neighbouring daily resistance, along with the RSI signalling upside momentum could slow, may be enough to prompt some profit-taking. That said, the underlying drivers remain strong in this market for now. As a result, while a reaction from said resistances could materialise, it is unlikely to gain much following. A breakout higher, on the other hand, swings the pendulum in favour of further outperformance, potentially as far north as US$3,000.
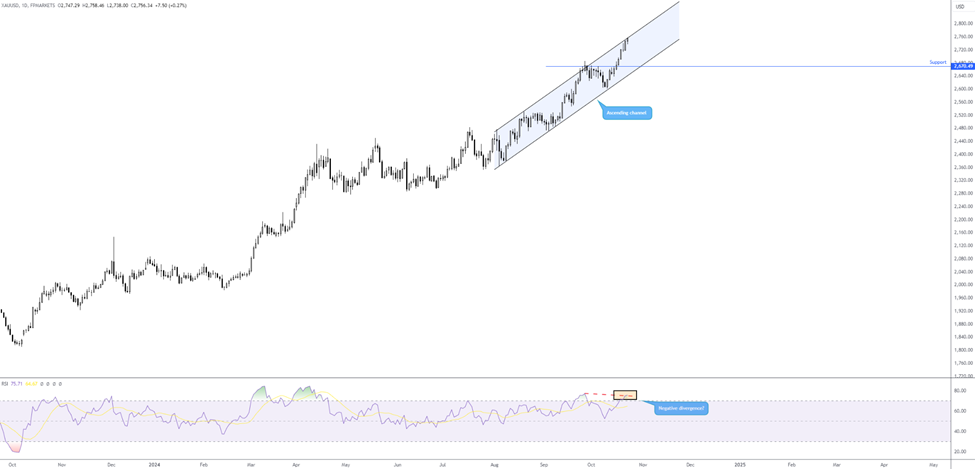
Chart created using TradingView
Author

Aaron Hill
FP Markets
After completing his Bachelor’s degree in English and Creative Writing in the UK, and subsequently spending a handful of years teaching English as a foreign language teacher around Asia, Aaron was introduced to financial trading,


