|

GBP/USD eyes 1.1952 as the next target — Confluence Detector

GBP/USD has been looking for a new direction as markets' concerns focused on Hong Kong, Italy, and Argentina. Nevertheless, the clock is ticking down to Brexit and both sides are far from reaching a deal. How low can the pound go? 

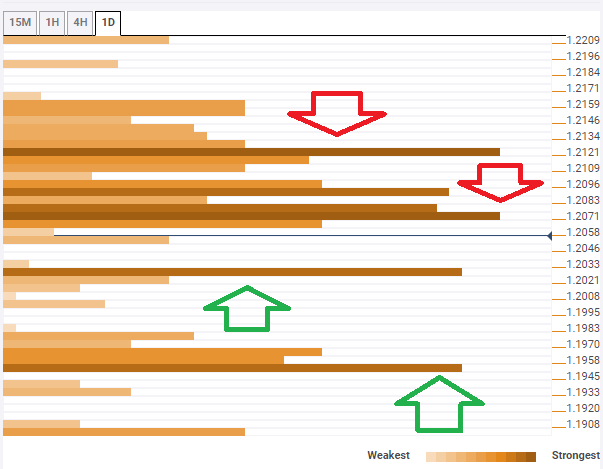
The Technical Confluences Indicator is showing that GBP/USD faces resistance at 1.2071 which is a dense cluster of lines including the Fibonacci 23.6% one-week, the Bollinger Band 15min-Middle, the Simple Moving average 5-1h, the SMA 200-15m, the SMA 50-1h, the Fibonacci 38.2% one-day, the BB 1h-Lower, and more.

Cable faces a minefield of hurdles on the way up with a noteworthy cap at around 1.2110 where the previous daily high, the SMA 5-1d, and the SMA 100-1h all converge. 

Looking down, support awaits at 1.2026 where the previous weekly low, the PP 1d-S1 and the previous daily low meet.

The most significant support line awaits only at 1.1952 where we note the confluence of the all-important BB 1d-Lower and the PP one-month Support 1. 

This is how it looks on the tool:

GBP USD technical confluence August 13 2019

Confluence Detector

The Confluence Detector finds exciting opportunities using Technical Confluences. The TC is a tool to locate and point out those price levels where there is a congestion of indicators, moving averages, Fibonacci levels, Pivot Points, etc. Knowing where these congestion points are located is very useful for the trader, and can be used as a basis for different strategies.

This tool assigns a certain amount of “weight” to each indicator, and this “weight” can influence adjacents price levels. This means that one price level without any indicator or moving average but under the influence of two “strongly weighted” levels accumulate more resistance than their neighbors. In these cases, the tool signals resistance in apparently empty areas.

Learn more about Technical Confluence

Author

Yohay Elam

Yohay Elam

FXStreet

Yohay is in Forex since 2008 when he founded Forex Crunch, a blog crafted in his free time that turned into a fully-fledged currency website later sold to Finixio.

More from Yohay Elam
Share:

Editor's Picks

EUR/USD trims gains, hovers around 1.1900 post-US data

EUR/USD trades slightly on the back foot around the 1.1900 region in a context dominated by the resurgence of some buying interest around the US Dollar on turnaround Tuesday. Looking at the US docket, Retail Sales disappointed expectations in December, while the ADP 4-Week Average came in at 6.5K.

GBP/USD comes under pressure near 1.3680

The better tone in the Greenback hurts the risk-linked complex on Tuesday, prompting GBP/USD to set aside two consecutive days of gains and trade slightly on the defensive below the 1.3700 mark. Investors, in the meantime, keep their attention on key UK data due later in the week.

Gold loses some traction, still above $5,000

Gold faces some selling pressure on Tuesday, surrendering part of its recent two-day advance although managing to keep the trade above the $5,000 mark per troy ounce. The daily pullback in the precious metal comes in response to the modest rebound in the US Dollar, while declining US Treasury yields across the curve seem to limit the downside.

XRP holds $1.40 amid ETF inflows and stable derivatives market

Ripple trades under pressure, with immediate support at $1.40 holding at the time of writing on Tuesday. A recovery attempt from last week’s sell-off to $1.12 stalled at $1.54 on Friday, leading to limited price action between the current support and the resistance.

Dollar drops and stocks rally: The week of reckoning for US economic data

Following a sizeable move lower in US technology Stocks last week, we have witnessed a meaningful recovery unfold. The USD Index is in a concerning position; the monthly price continues to hold the south channel support.

XRP holds $1.40 amid ETF inflows and stable derivatives market

Ripple trades under pressure, with immediate support at $1.40 holding at the time of writing on Tuesday. A recovery attempt from last week’s sell-off to $1.12 stalled at $1.54 on Friday, leading to limited price action between the current support and the resistance.