GBP/USD Elliott Wave: Forecasting the decline after irregular flat

In this technical article we’re going to take a look at the Elliott Wave charts charts of GBPUSD forex pair published in members area of the website. As our members know GBPUSD is showing incomplete bearish sequences and we were calling for an extension in weakness. Recently the pair corrected the short term cycle from the 1.2294 peak. Recovery unfolded as Elliott Wave Irregular Flat structure. Once the pair completed flat pattern, GBPUSD made decline toward new lows as expected. In further text we’re going to explain the forecast and Elliott Wave Pattern.
Before we take a look at the real market example of Expanded Flat, let’s explain the pattern in a few words.
Elliott Wave expanded flat theory
Elliott Wave Flat is a 3 wave corrective pattern which could often be seen in the market nowadays. Inner subdivision is labeled as A,B,C , with inner 3,3,5 structure. Waves A and B have forms of corrective structures like zigzag, flat, double three or triple three. Third wave C is always 5 waves structure, either motive impulse or ending diagonal pattern. It’s important to notice that in Irregular Flat Pattern wave B completes below the starting point of wave A. Wave C ends above the ending point of wave A . Wave C of Flat completes usually between 1.00 to 1.236 Fibonacci extension of A related to B, but sometimes it could go up to 1.618 fibs ext.
GBP/USD 1h hour Elliott Wave analysis 09.12.2022
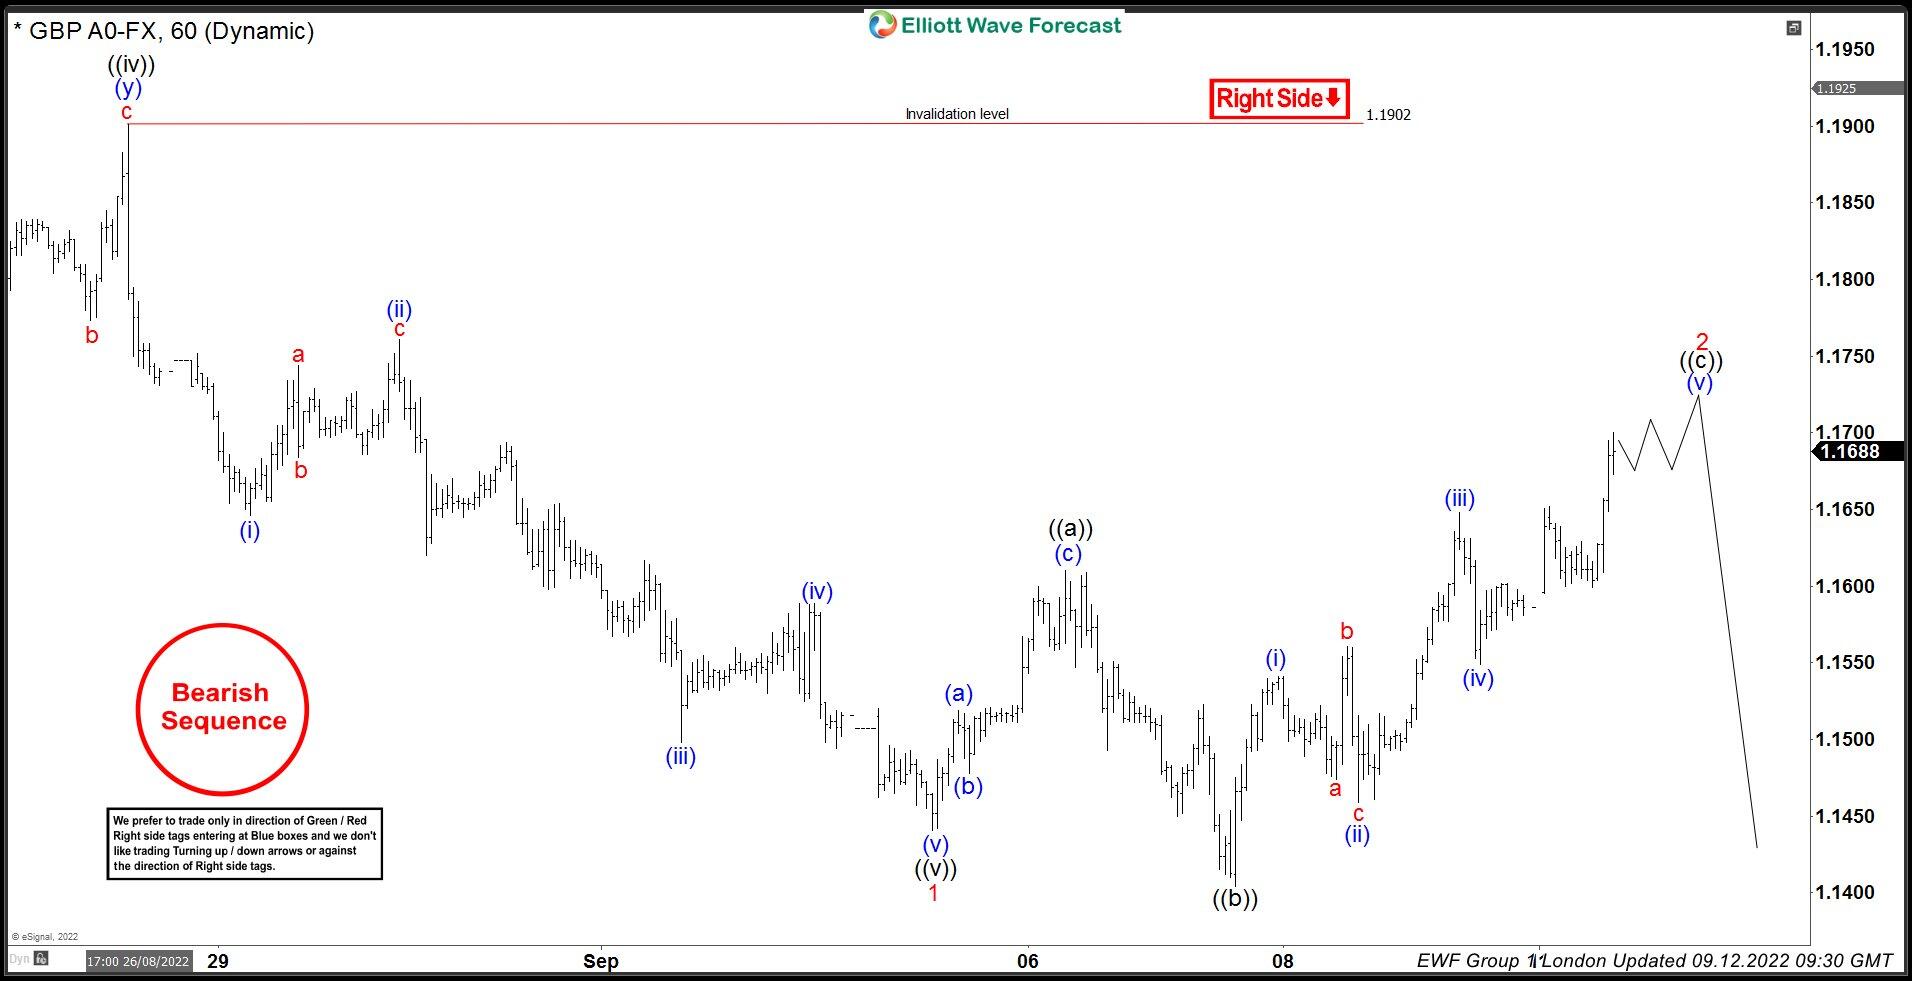
GBPUSD is giving us recovery against the 1.1902 peak that is unfolding as Expanded Flat Pattern. We can see waves ((a))and ((b)) black are showing corrective sequences. Wave ((b)) has broken the starting point of ((a)) while ((c)) has broken ending point of ((a)) which suggests this correction is unfolding as expanded flat. Wave ((c)) leg already shows 5 waves up. However if we downgrade the chart we can see that subdivison of (v) blue is still incomplete . We look for a shallow pull back and another marginal push up to complete the pattern. Approximate area to complete 2 red recovery comes at 1.1686-1.1770.
GBP/USD 1h hour Elliott Wave analysis 09.14.2022
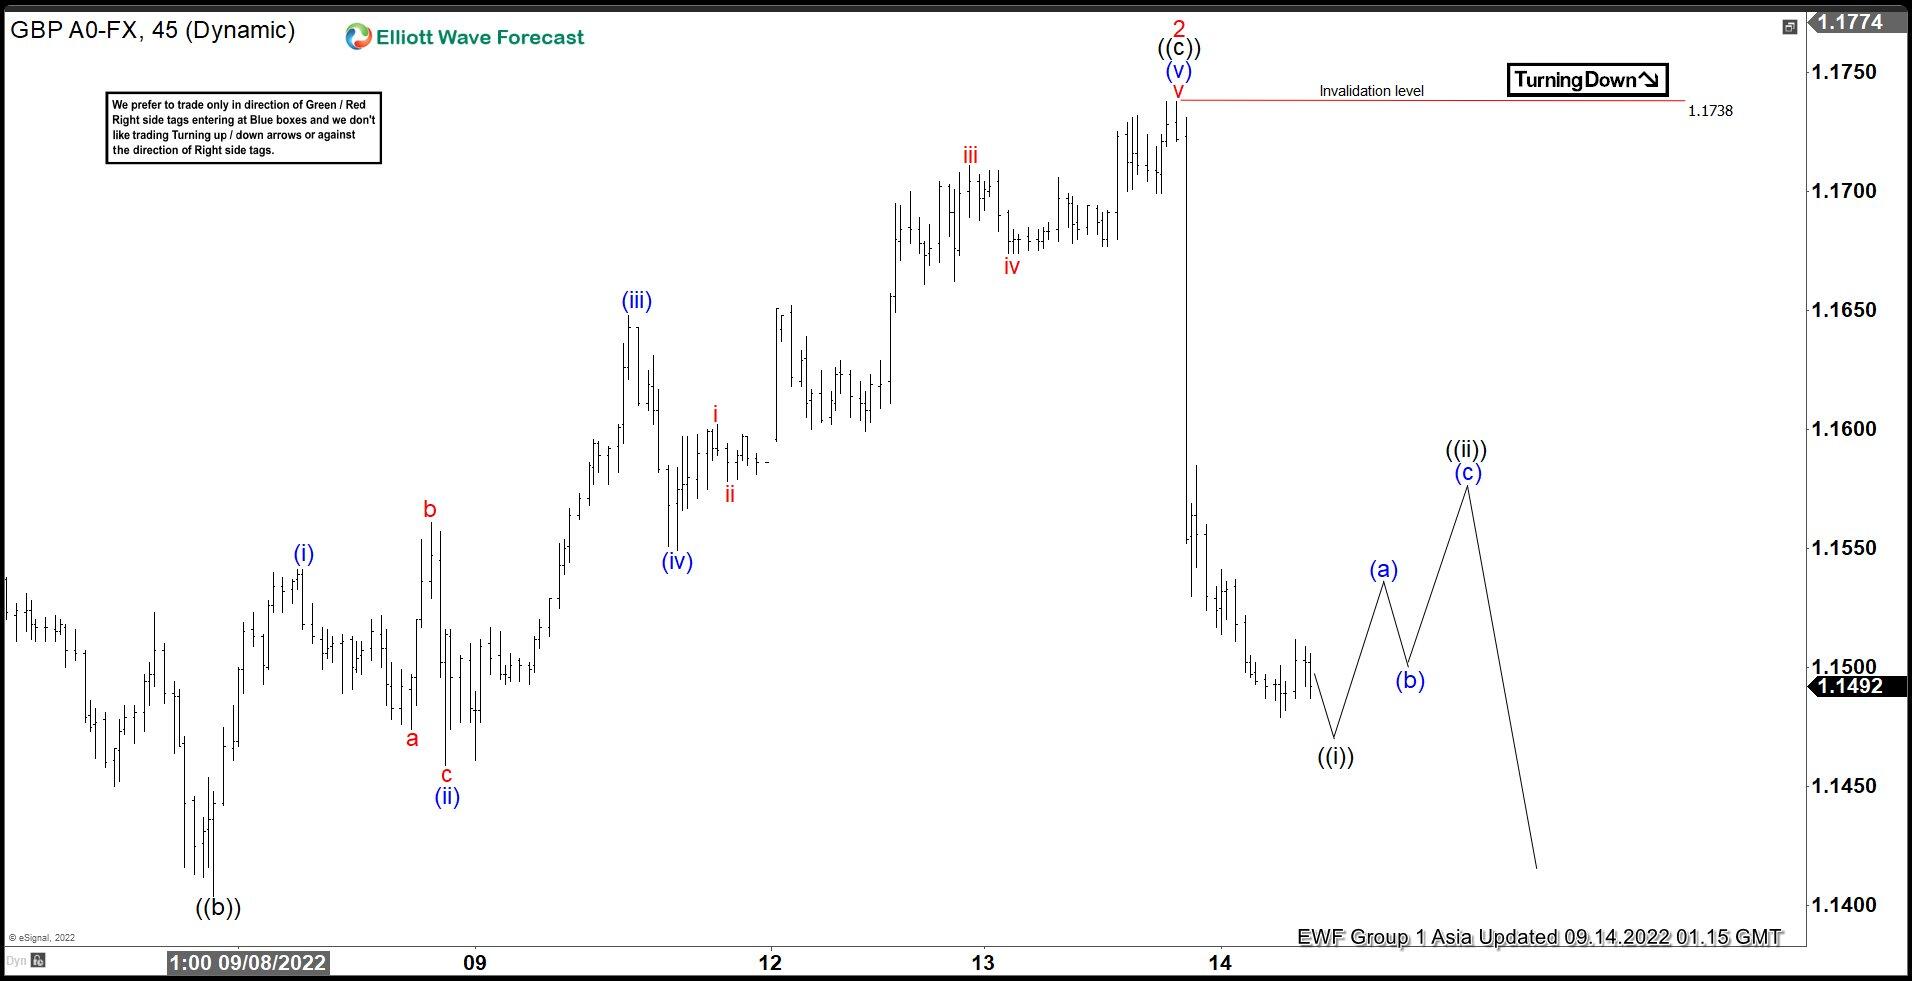
We got shallow pull back iv red of (v) blue and another high v red as expected. Wave 2 recovery completed as a expanded flat at 1.1738 high. GBPUSD made sharp decline from that high ,that looks impulsive. We expect ((i)) black to complete soon after which we should ideally see a 3 waves bounce in ((ii)) black. As far as 1.1738 pivot holds, more weakness should be ideally seen in the pair.
GBP/USD 1h hour Elliott Wave analysis 09.17.2022.
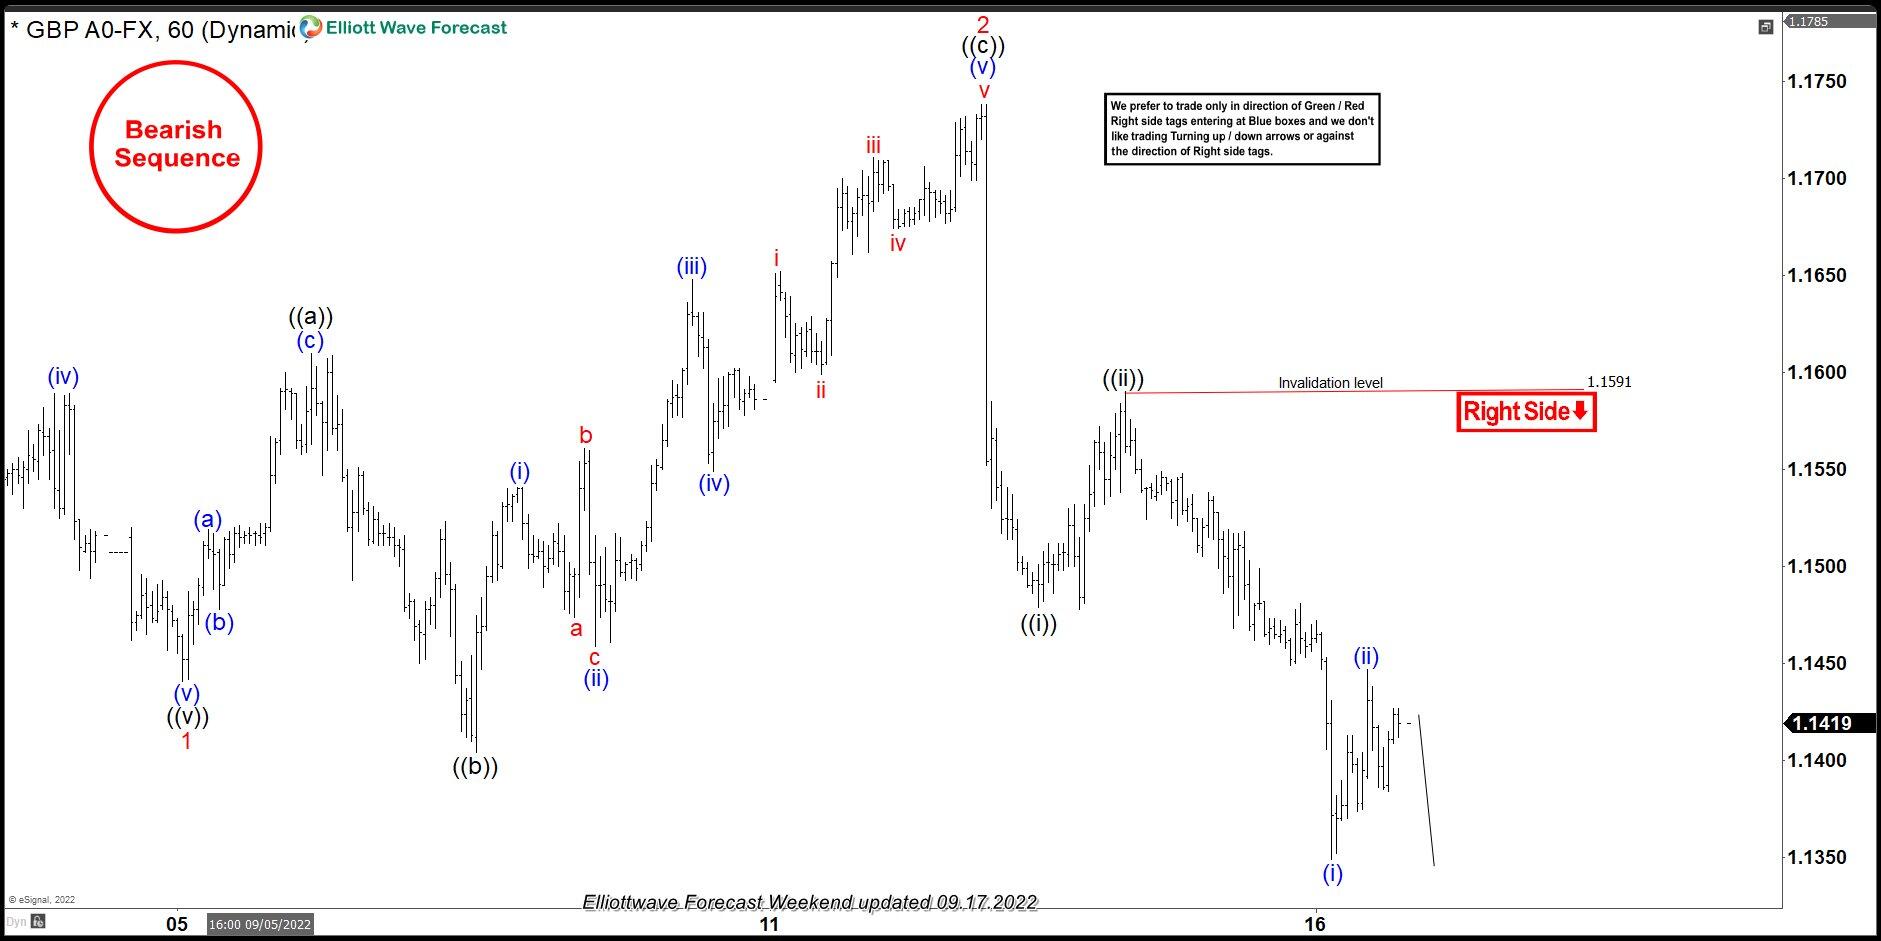
The pair has given us 3 waves bounce ((ii)) black that ended at 1.1591 high. After short term bounce , the pair found sellers again and made drop toward new lows as expected. Now GBPUSD remains bearish against the 1.159 high in first degree.
Author

Elliott Wave Forecast Team
ElliottWave-Forecast.com


