FXS Surprise Index: Negative results in all major economies explain central banks' dovishness
- FXS Surprise Index shows major economies consistently underperforming expectations.
- Central banks trying to revert this path by going back to accommodative monetary policies.
- EMU vs US Surprise Index differential shaped EUR/USD downtrend.
- Canadian economy leading the way with stable performance, aiming to be the only one in positive territory.

It's been a rough last 12 months for the world economy. Macroeconomic performance peaked after four years (2014-2017) of positive numbers across the board but turned south during 2018, as FXStreet Surprise Index clearly shows. Even if performance was positive during that four-year period, none of the major economies FXS Surprise Indexes was able to reach above-zero ground, barring a small lapse in early 2018 where the European Monetary Union's figures stepped on positive territory.
Since the start of 2018, downtrends have dominated most indexes, with the European Monetary Union (EMU) and the United States ones leading the way in their decline. Looking at this trend, it's easy to see some of the reasons behind the recent trend of dovishness among central bankers, with the Fed, the ECB and others having recently moved back to accommodative stances in their monetary policy statements. Is macro data performance about to hit rock bottom or does the current downtrend still have more steam to find new lows?
FXS Surprise Index evaluates economic performance for a county (or economic area, such as the EMU) in relation to expectations, aggregating its most relevant macroeconomic indicators deviation numbers (read more about it at the end of the article). FXS Surprise Index's data starts on Jan 1st 2011, so the zero-level for a given index means that economic releases in that country have been neutral since then.
EMU vs US Surprise Index: Shaping EUR/USD downtrend
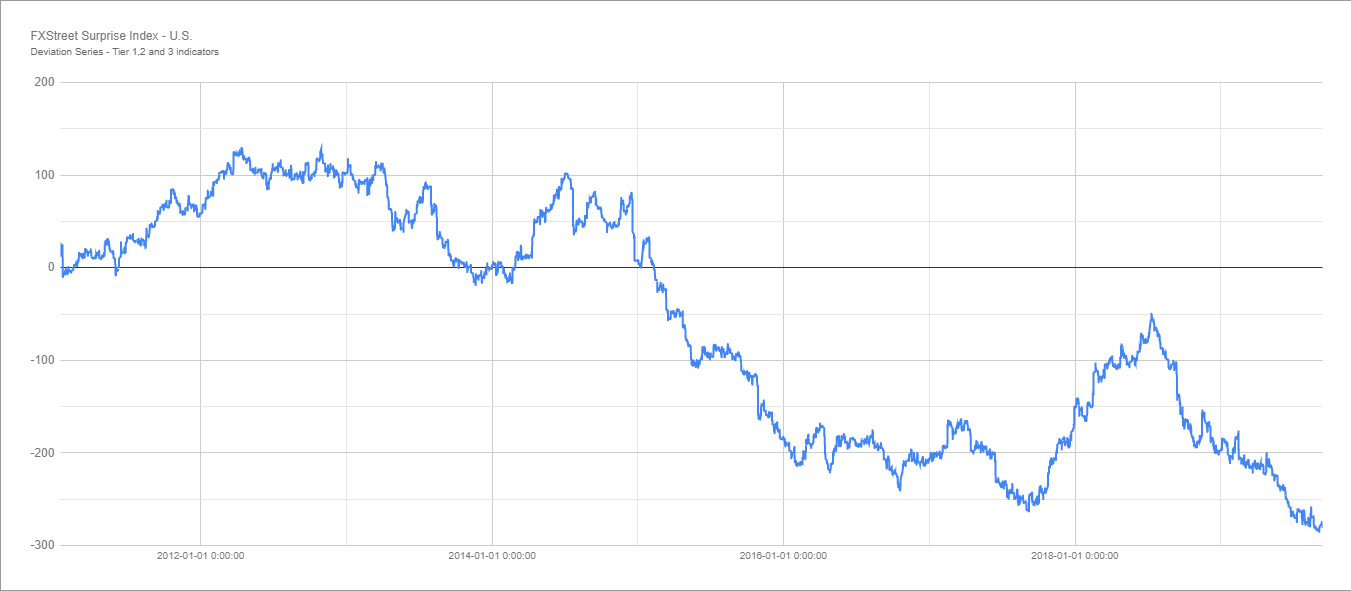
FXS Surprise Index chart for the last two natural years is dominated by the notable downtrends in the two major economies: the US and the EMU.
-637044862106096209.png)
The European index peaked in early 2018, reaching its all-time high (FXS Surprise Index data starts in 2011) on Jan, 26th at 47.9 and started a relentless and very steep fall that has only decelerated a bit in the last six months. Even if the downtrend has slowed down, EMU Surprise Index hit its all-time lows last month (on Aug 22nd) at -162.15, only to recover a bit during the last weeks to the current -146.50 level.
Help us improve. Your opinion counts! Leave your feedback here
The US index trailed its European counterpart in the process of peaking, as Trump's early-mandate tax cuts effect inflicted a good burst to the US macroeconomic performance. US Surprise Index hit a -52.66 relative high in July 2018 (far from its 129.75 all-time high of April 2012) but has plummeted since, having reached its all-time lows as recent as Sept 6th, when it reached -279.16.
A short-term bullish turning point could be nearing as expectations moderate and the Fed's recent rate cuts take effect, but it's still ways to go for the world's biggest economy from more positive levels that might pump up the markets.
-637044875770008162.png)
EUR/USD has experienced a meaningful correlation with these performances, also peaking in early 2018 and falling quite steeply before US Surprise Index peaked in the summer of 2018, since when the downtrend has moderated, although it remains in place.
US Dollar's status as the world's base currency plugged with the safe-haven nature of the Greenback have continued to add to the current USD strength despite the lag between both Surprise Indexes increasing a bit, so it will be difficult for the EUR to change course if European macroeconomic data fails to pick up some steam, which doesn't seem to be close to happening any soon.
Canada leads the way while the UK struggles to find a bottom
The broader picture is not much nicer than what the two biggest economies have to show. Every major FXS Surprise Index is currently in negative territory, although short-term downtrends in most economies here have been more moderate.
-637044835223614575.png)
With Brexit fallout still affecting British macroeconomic performance, as business and consumers lack confidence and a clear outlook of UK's political and legal status, UK Surprise Index has been stuck in a deeply negative ground for more than one year, staying in a range between -210 and -250. These are not all-time lows, set just before Brexit's referendum on April 2016, but have the chance to provide a bullish double-bottom pattern if the Brexit conundrum ends up with a deal sooner rather than later, which would benefit the Pound. But like everything UK-related these days, it's all about Brexit, so trends are secondary here.
On the other hand, the Canadian economy recent performance is the brightest spot, or should we say the cleanest shirt in the laundry basket? Canada's FXS Surprise Index has kept a very stable sideways trend for the last 18 months, moving slightly below the zero-line for nearly all the time. A recent pick-up in the last weeks seems quite promising, with the index having risen from -22 to the current -1.82 level in less than three weeks. All-time highs (set at a modest 7.10 level more than eight years ago) are in play if Canada continues its recent macroeconomic positive trend.
The Australian and, particularly, the Japanese FXS Surprise Index carry less importance to their currencies, as AUD and JPY are strongly affected by other dynamics (Chinese economic performance for the Aussie and stock market performance for the Yen). The Australian index has been the most stable one, unable to escape from a range between -70 and -100 for the last 18 months as the economy from Down Under has mostly trodden water. Things are certainly worse on the Japanese data performance, which keeps failing to match expectations since the start of the Surprise Index calculations in 2011 and is now close to making new all-time lows set last August at a dismal -364.42 level.
About the FXStreet Surprise Index
FXStreet Surprise Index quantifies, in terms of standard deviations of data surprises (original releases vs. survey median), the extent to which economic indicators exceed or fall short of consensus estimates.
Economic reports with better- or worse-than-expected news are assigned a positive or negative deviation value, while reports meeting expectations get a 0 deviation value. Adding up the values of the deviations, and you get an initial series showing how economic data are progressing relative to the consensus forecasts of market economists. The deviation formula employs a ratio function to replicate behavioral anchors of market participants.
Preserving the properties of these underlying series, the index finally shows the detrended momentum of the surprises in relation to previous weeks.
Surprise Indexes are constructed for the United States, Euro Area, Germany, United Kingdom, Canada, Japan, Australia and New Zealand.
Author

Jordi Martínez
FXStreet
Jordi Martínez is the Editor in Chief at FXStreet, leading editorial operations at the company, before being promoted to the role in 2023, he worked in several editorial positions at FXStreet, including roles as Senior Editor and


-637044859131360193.png)
-637044886748542467.png)
-637044897975516088.png)