FTSE 100 continues in the wide area between 7.300 - 7.600
FTSE 100 (UKX)
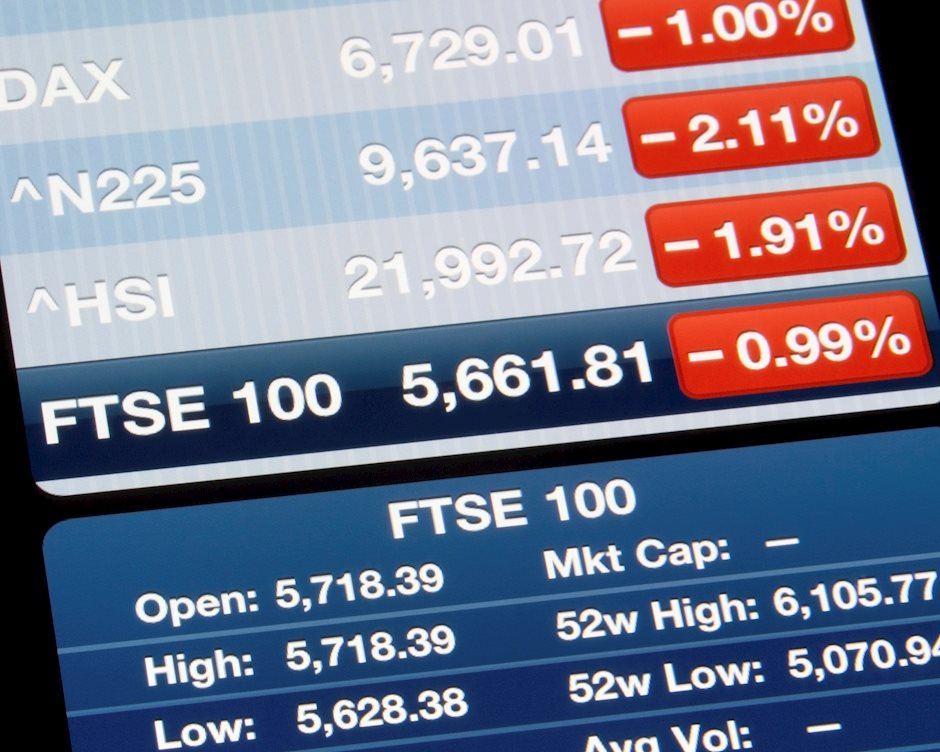
The FTSE 100 ended the week down by -0.38%
For the coming week we could see a consolidation between 7.400 - 7.350 to then move higher.
Indicators
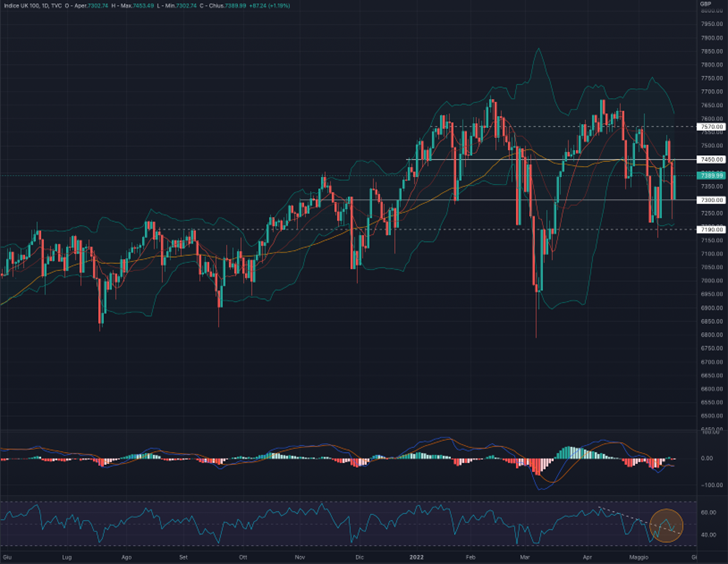
The substantial lateralisation of the FTSE100 continues in the wide area between 7.300 - 7.600 and we believe the rebound on the support at 7.300 is very positive for a short-medium term scenario.
For the coming week we could expect a consolidation followed by a push to the upside: specifically, the index could slightly lateralise in the 7.350 area to then point to break the current resistance level.
MACD and RSI both signal a recovery in strength, with the former intending to reverse to the upside and the RSI which, after breaking the bearish trendline, back-tested it on Thursday.
We remain positive on the British index and in favour of a break of the 7,450 level.
Support at 7.300.
Resistance at 7.450.
FTSEMIB (FTSEMIB)
The FTSEMIB had a week up by + 0.19%.
For the week ahead we could see a consolidation between 23.250 - 24.600 followed by a move to the upside.
Indicators
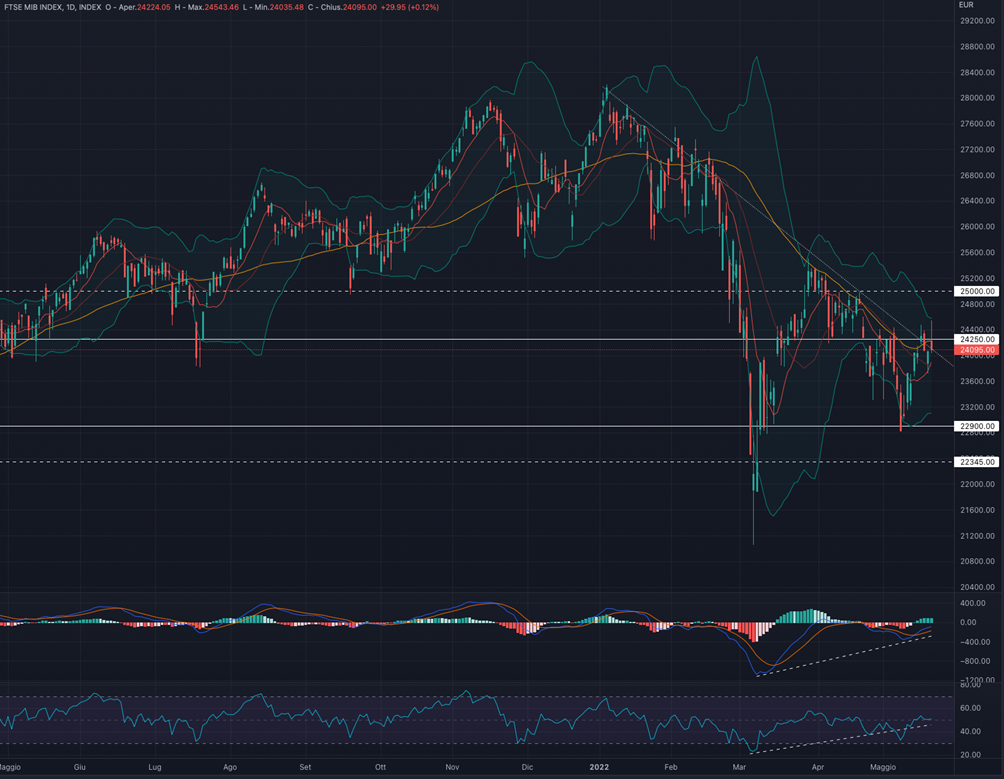
Overall a positive weekly price action in a short-medium term scenario: the fact that the index is consolidating near the strong bearish trendline, we consider it a promising factor, expecting an upcoming break of it.
MACD and RSI seem to favour a bullish push of the index, with the first close to an upward reversal and the second on 50 line (bullish). Both indicators are also respecting the series of rising lows that began in March 2022.
The slight contraction of the Bollinger Bands, combined with a slight upside reversal of the 50MA (yellow line) suggests strong short-term volatility.
We are positive on the FTSEMIB and believe that a consolidation above 24.250 could then lead to bigger upside.
Support at 22.900.
Resistance at 24.250.
DAX 40 (DAX)
The DAX ended the week down by -0.33%.
For the week ahead, we are in favour of a consolidation between 13.800 -14.050 followed by a move to the upside.
Indicators
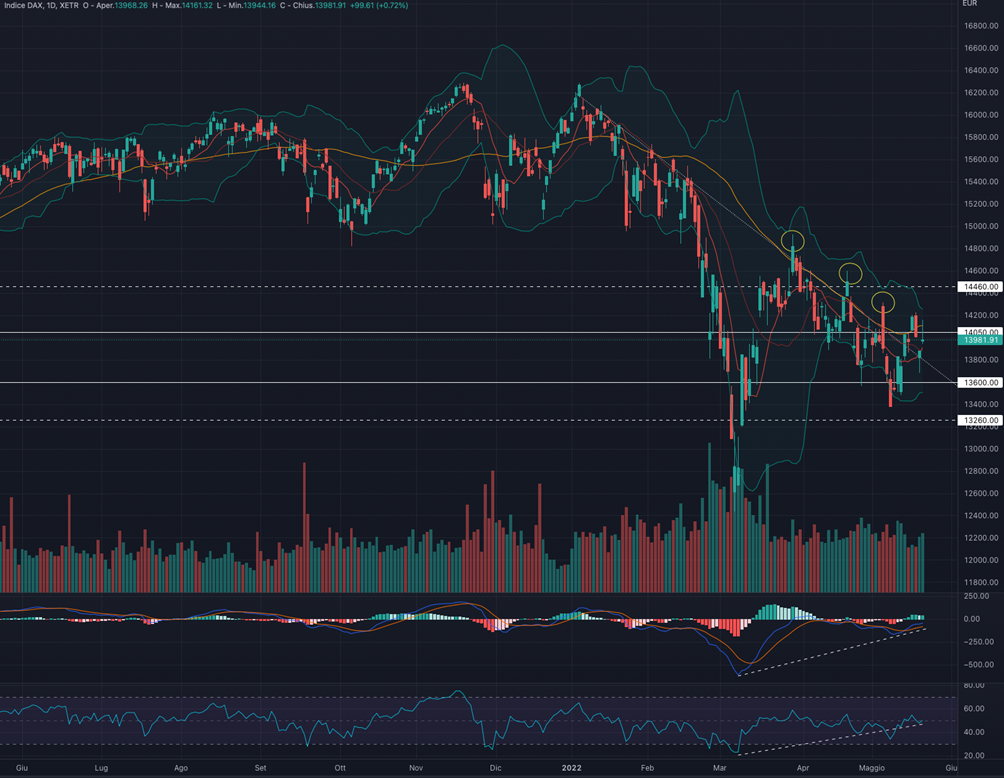
In the short-medium term, we believe the break and slight consolidation above the bearish trendline in place since the beginning of 2022 is a very positive signal.
MACD and RSI appear to support a bullish recovery in the DAX, with the former near a bullish cross and the latter very close to breaking the 50 line (bullish).
It is still too early to understand if the index will be able to break the resistance level (as well as the 50MA) and reverse to the upside.
A scenario like March 29, April 21 and May 5 is still possible. At the same time, we believe that the greatest difference between this price action and the past ones lies in the RSI: the indicator exited the oversold area and broke the bearish trendline in existence since March 2022, which did not happened in previous occasions.
In addition, with this week we can now see a slight upside reversal of the 50MA: further positive indicator.
We are positive on the DAX and in favour of a possible short to medium term upside reversal.
Support at 13.600.
Resistance at 14.050.
S&P 500 (SPX)
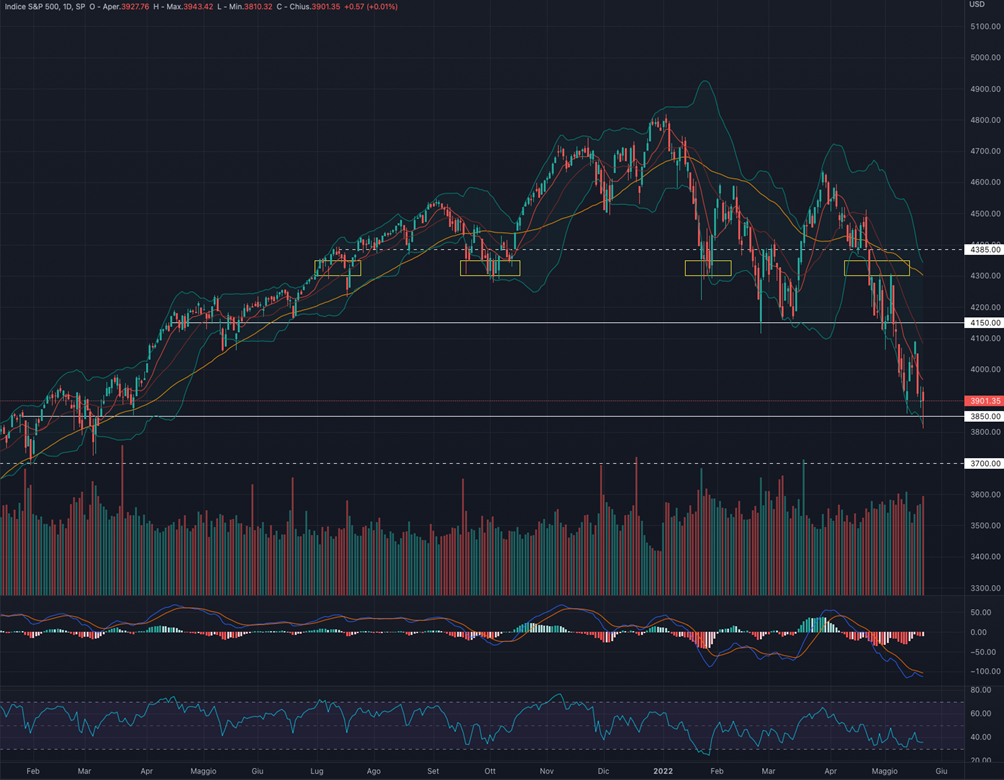
The S&P500 had a week down by -3.05%.
For the week ahead, we are in favour of a recovery to at least 4.090.
Indicators
Despite a further week of declines on the SPX, we believe that the index is trying to support from which to begin a short-medium term recovery.
MACD and RSI are both very extended to the downside with the second in positive divergence with the price action. Divergence that comes after a series of strong bearish candles at the end of the week: a factor that we consider very positive.
As also pointed out the previous week, we believe that the S&P500 is now strongly extended to the downside, shifting its risk /reward in favour of long positions.
The short-term target is 4.150: a break of it could then bring the index to 4.300 in the medium term.
Support at 3.850.
Resistance at 4.150.
Nasdaq100 (NDX)
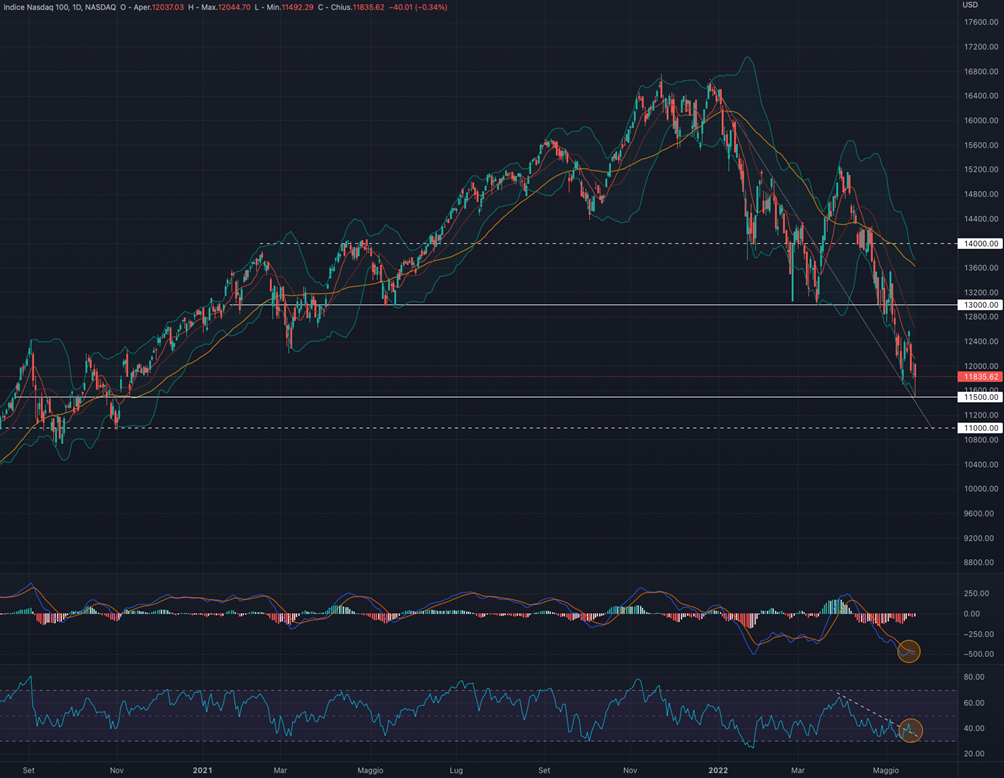
The NASDAQ ended the week down by -2.90%.
For the week ahead we are in favour of a consolidation between 11.900 - 12.200 followed by a possible push to the upside.
Indicators
Despite another bearish week, we believe that the index may soon begin a slow upward recovery. The price action of the week just ended continue to be above the bearish trendline which we believe to be a positive indicator: further confirmation will be given by the break of the 9MA (red line) at 12.200.
MACD and RSI are both very extended to the downside, which makes us shift the risk /reward ratio in favour of possible price recovery and trend reversals. We highlight a positive divergence between RSI and price which, given the strong bearish candle on a weekly basis, makes us lean towards a possible short-term recovery.
Still on the RSI, another factor to monitor is the backtest just carried out on the bearish trendline, despite a new low price reported on Friday.
The price action on the trendline combined with the bearish extension of internal indicators make us remain positive on the Nasdaq and in favour of a price recovery with a short-term target of 13,000 (important breaking point).
Support at 11.500.
Resistance at 13.000.
Dow Jones (DJI)
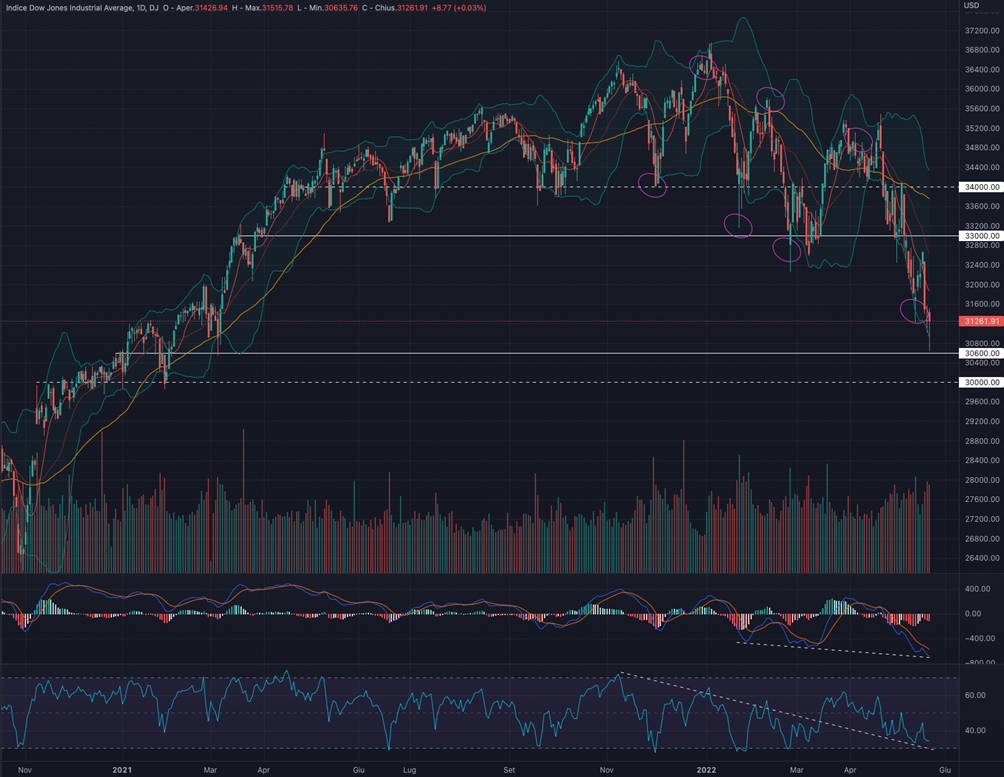
DOW JONES had a week down by -2.90%.
For the week ahead, we expect a short-term recovery to at least 32.800.
Indicators
The index is still looking for a support that can lead to a short-term bullish recovery: the area between 31,600 and 30,600 could serve as a consolidation as happened at the beginning of 2021.
MACD and RSI are now very extended to the downside, which makes us lean towards a recovery in strength of the index and bullish price action in the short term.
A slight positive divergence between price and RSI should be underlined as a positive indicator for the short-medium term.
In the terms of price confirmation, we are seeking a break of the 9MA (red line) at 32.000.
We are positive on the DJI and we believe that once the support has been found, the recovery can be very fast: the trend still remains bearish and it is precisely in these cases that strong bear market rally can be held.
Given also the considerable distance from the 50MA (yellow line).
Support at 30.600.
Resistance 33.000.
Author

Francesco Bergamini
OTB Global Investments
Francesco, BSc Finance and Msc in Business Management, graduated with Merit, is a professional with experience in the financial services industry and a keen interest in the financial markets.


